OpenTelemetry Tracing for Kedify Proxy & Interceptor
By following these steps you can get more insights about the HTTP calls that are being handled by Kedify Proxy. Both components, Kedify Proxy and http-add-on interceptor are instrumented by
OpenTelemetry and if enabled, they report the traces into OpenTelemetry Collector or tools like Jaeger, Zipkin, Tempo.
Step 1: Deploy Jaeger all-in-one
For our purposes we will be using Jaeger that has a OTLP receiver on port 4317 opened.
helm repo add jaeger-all-in-one https://raw.githubusercontent.com/hansehe/jaeger-all-in-one/master/helm/chartshelm repo update jaeger-all-in-onehelm upgrade -i jaeger-all-in-one jaeger-all-in-one/jaeger-all-in-one --set enableHttpOpenTelemetryCollector=trueAlternative to this would be deploying the OTel collector that will have a OTLP receiver and various number of exporters. This way one can send the traces to multiple tools.
# Alternatively, deploy OTel collectorcat <<VALUES | helm upgrade -i otel-collector oci://ghcr.io/kedify/charts/otel-add-on --version=v0.0.12 -f -deployScaler: falseotelCollector:  enabled: true  alternateConfig:    receivers:      otlp:        protocols:          grpc:            endpoint: 0.0.0.0:4317          http:            endpoint: 0.0.0.0:4318
    exporters:      otlp: {}      zipkin:        endpoint: http://zipkin.zipkin:9411/api/v2/spans      otlp/jaeger:        endpoint: http://jaeger-all-in-one.default.svc:4317        tls:          insecure: true      debug:        verbosity: detailed
    service:      pipelines:        metrics:          receivers: [otlp]          processors: []          exporters: [debug]        traces:          receivers: [otlp]          exporters: [debug, otlp/jaeger, zipkin]VALUES
Step 2: Deploy Kedify
cat <<VALUES | helm upgrade -i kedify-agent kedifykeda/kedify-agent --version=v0.2.14 -nkeda --create-namespace -f -agent: orgId: ${KEDIFY_ORG_ID} apiKey: ${KEDIFY_API_KEY}clusterName: hello-tracingkeda: enabled: truekeda-add-ons-http: enabled: true interceptor: replicas: max: 1 additionalEnvVars: - name: OTEL_EXPORTER_OTLP_TRACES_ENABLED value: "true" - name: OTEL_EXPORTER_OTLP_TRACES_ENDPOINT value: "http://jaeger-all-in-one.default.svc:4317" - name: OTEL_EXPORTER_OTLP_TRACES_PROTOCOL value: "grpc" - name: OTEL_EXPORTER_OTLP_TRACES_INSECURE value: "true"VALUESIf you used the dedicated OTel collector in the previous step, then OTEL_EXPORTER_OTLP_TRACES_ENDPOINT should be set to http://otelcol.default.svc:4317.
Step 3: Deploy Example Client & Server Applications
We have prepared a simple client-server architecture. These two applications are based on opentelemetry-java-examples
repo. Some additional changes were made in this fork. Both, client and server app create its own child span to better simulate a
real use-case.
Server Application
kubectl create deploy otel-tracing-server --image=docker.io/jkremser/otel-tracing-server --port=8080kubectl expose deploy otel-tracing-server --name=otel-tracing-server-fallback --type=ClusterIP --port=8080 --target-port=8080kubectl set env deploy/otel-tracing-server OTEL_EXPORTER_OTLP_TRACES_ENDPOINT="http://jaeger-all-in-one.default.svc:4317"Client Application
kubectl create deploy otel-tracing-client --image=docker.io/jkremser/otel-tracing-clientkubectl set env deploy/otel-tracing-client \ SERVER="otel-tracing-server:8080" \ SLEEP_MS="600000" \ OTEL_EXPORTER_OTLP_TRACES_ENDPOINT="http://jaeger-all-in-one.default.svc:4317"Prepare the Kubernetes Service for the Server app to meet the kedify-http scaler requirements:
kubectl get svc otel-tracing-server-fallback -oyaml | yq 'del(.spec.clusterIPs, .spec.clusterIP, .spec.selector, .spec.internalTrafficPolicy, .spec.ipFamilies, .spec.ipFamilyPolicy, .status, .metadata)' | yq '.metadata.name="otel-tracing-server"' | kubectl apply -f -Create a ScaledObject for Server Application
cat <<SO | kubectl apply -f -kind: ScaledObjectapiVersion: keda.sh/v1alpha1metadata: name: otel-tracing-serverspec: scaleTargetRef: apiVersion: apps/v1 kind: Deployment name: otel-tracing-server cooldownPeriod: 5 minReplicaCount: 0 maxReplicaCount: 1 pollingInterval: 30 fallback: failureThreshold: 2 replicas: 1 advanced: restoreToOriginalReplicaCount: true horizontalPodAutoscalerConfig: behavior: scaleDown: stabilizationWindowSeconds: 5 triggers: - type: kedify-http metadata: hosts: otel-tracing-server service: otel-tracing-server port: '8080' scalingMetric: requestRate targetValue: '1' granularity: 1s window: 10s trafficAutowire: service fallbackService: otel-tracing-server-fallbackSOOnce, this is created, it should scale the otel-tracing-server deployment to 0 replicas, because there is no HTTP traffic.
Check the Traces
Client application was configured to make a call each (SLEEP_MS=600000) ten minutes. If you don’t want to wait, you can restart the client app and force it to make a quick request:
kubectl rollout restart deploy/otel-tracing-clientTo check the traces:
(kubectl port-forward svc/jaeger-all-in-one 16686 &> /dev/null)& pf_pid=$!(sleep $[10*60] && kill ${pf_pid})&open http://localhost:16686As a service select http-call (to capture the whole span) and you should be able to see a page similar to this:
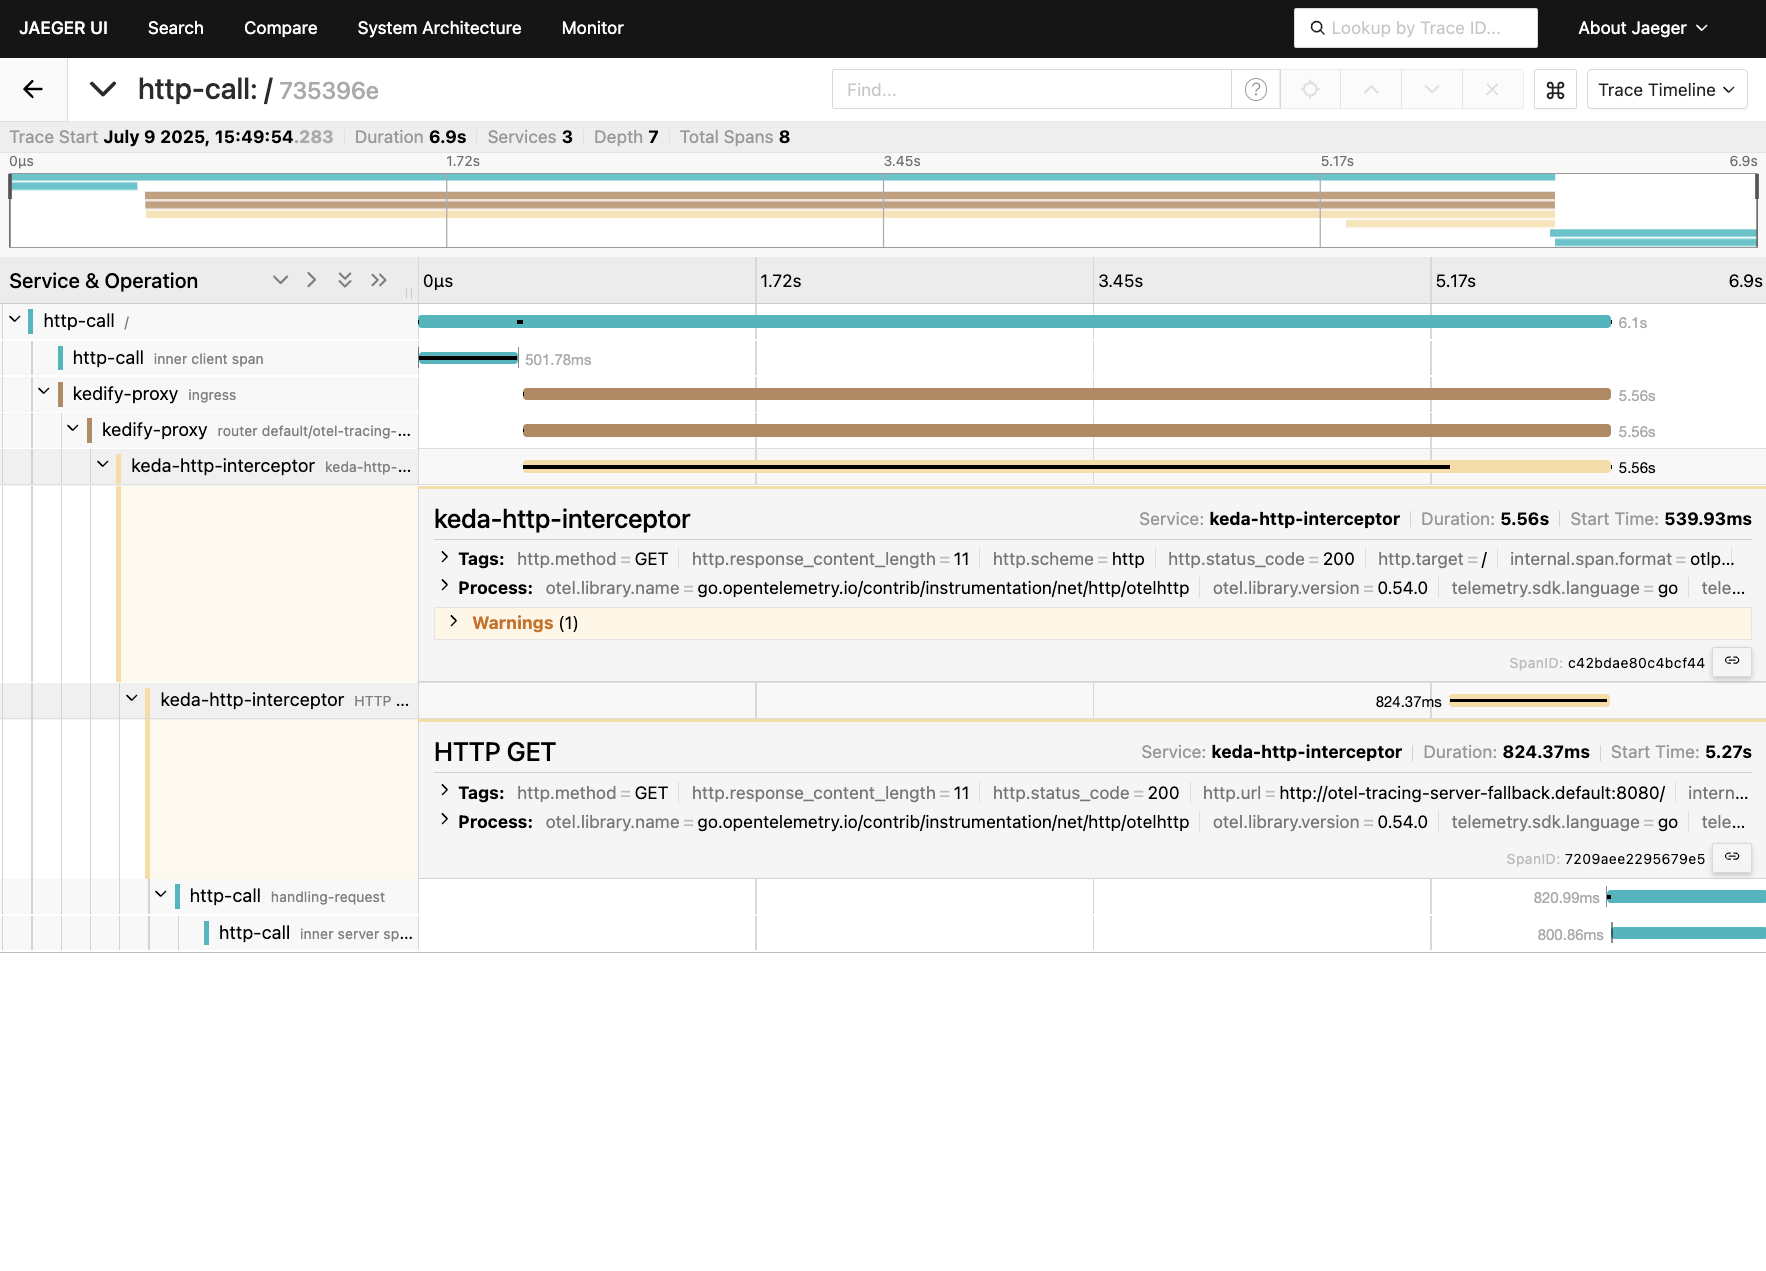
We can see here:
- inner span on the client took ~500ms
- then the HTTP call traveled via kedify-proxy (span called “ingress”). Kedify-proxy contributed 2ms overhead to the HTTP call.
- the application was scaled to 0 so we were experiencing a cold start. This is represented by the span called
keda-http-interceptorwhich took about ~5.5s - the inner server span took ~800ms
Conclusion
We were able to see the whole lifecycle of the HTTP call throughout multiple micro-services. If any of the components has the tracing turned off, we should still be able to see the traces, but with less details (there will be missing spans). This applies also for the client and server app, if we don’t care about the context propagation and tracing the call from end to end, we can enable it only for the Kedify Proxy.
In order to turn on the tracing on for an existing deployment just run:
kubectl set env -nkeda deploy/keda-add-ons-http-interceptor \ OTEL_EXPORTER_OTLP_TRACES_ENABLED="true" \ OTEL_EXPORTER_OTLP_TRACES_ENDPOINT="http://jaeger-all-in-one.default.svc:4317" \ OTEL_EXPORTER_OTLP_TRACES_PROTOCOL="grpc"