 All Posts
At 5,000 Services, HPA Took 7 Minutes and KPA Just 25 Seconds
August 04, 2026
At 5,000 Services, HPA Took 7 Minutes and KPA Just 25 Seconds
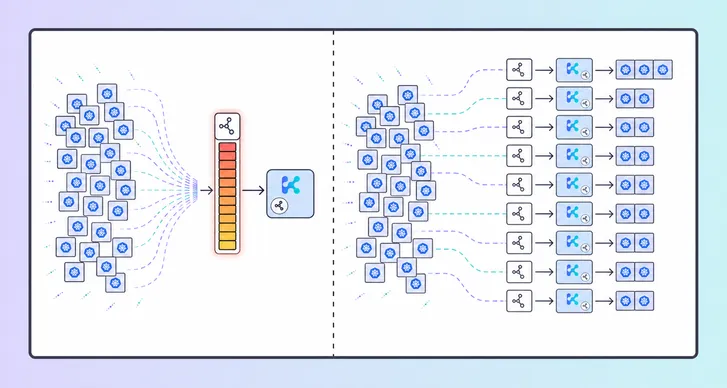
In our first KPA post, we argued that autoscaling becomes a capacity problem when thousands of workloads share one decision loop. The architecture was clear. The missing part was the measurement.
So we generated up to 5,000 ScaledObjects in one AKS cluster and compared three layouts: KEDA-generated native HPAs, one cluster-wide Kedify Pod Autoscaler (KPA) , and ten tenant KEDA + KPA shards.
The seven-minute number in the title is the cold-start p99 for HPA: after creating all 5,000 autoscalers at once, the slowest one percent reached their first scale action in 443 seconds. Ten KPA shards reached the same percentile in 25 seconds.
The Result at 5,000 Applications
The benchmark changed a shared metric by enough to force a real scale action, then measured the autoscaler’s lastScaleTime. Cold latency starts at each ScaledObject creation timestamp. Warm latency starts at one synchronized metric change after every autoscaler already exists.
| Scale action latency | Native HPA | One KPA | 10 KPA shards | HPA ÷ sharded KPA |
|---|---|---|---|---|
| Cold p50 | 129s | 112s | 1s | 129.0× |
| Cold p99 | 443s | 427s | 25s | 17.6× |
| Warm p50 | 41s | 24s | 7s | 5.9× |
| Warm p99 | 81s | 47s | 15s | 5.4× |
The HPA run’s KEDA client and the single-KPA run’s KEDA/KPA clients needed kube-api-qps=200 and burst=400 to finish the 5,000-object run. Every KEDA/KPA pair in the ten-shard layout used 100/200. The cluster-managed native HPA controller itself was not tuned. This is not an untuned-default comparison; it is more favorable to the two single-controller layouts, because their configurable clients received twice the request budget.
Cold fan-out is the sharpest result. One controller must process a creation backlog thousands of objects deep while periodic reconciliations for the objects already created continue to arrive. Ten shards turn one 5,000-object queue into ten queues of roughly 500 objects each.
Warm decisions show the same boundary without the creation work. With a 15-second sync period, an uncongested controller has an expected median floor near 7.5 seconds and a p99 near 15 seconds. The sharded layout stayed on that floor at 5,000 applications. HPA added roughly 34 seconds at the median and 66 seconds at p99.
Tuning Moved the Wall. It Did Not Remove It.
The first bottleneck was the Kubernetes client’s token bucket, not controller CPU. We isolated it in the single-KPA layout by keeping the KEDA operator at 100/200 and changing only the KPA controller’s request rate:
| Applications | KPA qps 20 p50 | KPA qps 100 p50 | Improvement |
|---|---|---|---|
| 1,000 | 47s | 9s | 5.2× |
| 2,500 | 118s | 23s | 5.1× |
That is an 81% median-latency reduction from one setting. It is also why a benchmark that leaves the controller at 20 qps mostly measures the rate limiter.
But increasing qps has a ceiling. At qps 100, the 5,000-object HPA and single-KPA runs did not finish; autoscaler creation plateaued near 2,950 objects. A single KPA at qps 150 plateaued near 4,300. Qps 200 completed. At qps 300, this AKS control plane began dropping etcd raft proposals and the run failed.
Those values are not universal tuning recommendations. They describe one cluster and make the trade-off visible: one controller eventually needs a client rate high enough to threaten a shared control-plane limit. Sharding keeps the per-controller queue and request budget bounded, although every shard still shares the same API server and etcd. Aggregate control-plane load must still be tested.
The curves make the useful operating boundary clearer than one headline number. Through 1,000 applications, all three layouts are close to the warm sync floor after tuning. The knee appears at 2,500. At 5,000, the single-controller layouts need another qps increase while the ten-shard layout remains flat.
What We Actually Tested
| Dimension | Configuration |
|---|---|
| Platform | Dedicated AKS cluster, Kubernetes 1.34, Standard control plane |
| Workload capacity | 48 worker nodes, up to roughly 10,000 lightweight Pods |
| Population | 100, 500, 1,000, 2,500, and 5,000 generated ScaledObjects |
| Reported cohort | Shared external metric: 4,400 of 5,000 objects, about 88% at every size |
| Layouts | One KEDA + native HPA; one KEDA + one KPA; ten tenant KEDA + KPA pairs |
| Timing | 15s autoscaler sync; 30s KEDA polling interval |
| Measurement | Real scale action from second-granular Kubernetes timestamps; pod scheduling excluded |
Every result shown above came from a completed run that passed the harness’s automated evidence gates: no missing scale timestamps, missing autoscalers, pending benchmark Pods, metric-backend errors, or backend restarts. Each population-and-layout point is still one run in one environment, not a confidence interval. Treat the ratios as evidence of the control-loop shape, not a capacity promise for another cluster.
“Native HPA” here also has a specific meaning: the HPA was generated by KEDA and driven through external.metrics.k8s.io. This is the realistic KEDA baseline, not a claim about a hand-authored CPU HPA with no external metrics path.
The Part That Matters
KPA did not win merely because a different binary computed the replica count. One unsharded KPA also slowed into the minutes during cold fan-out.
The winning layout changed the unit of scale. Instead of making one controller progressively faster, it added controllers and kept each ownership set bounded. That is the practical result behind the architecture in our first post: compute can stay consolidated in one large cluster while the autoscaling decision plane scales horizontally.
The full percentile tables, request-rate experiments, methodology, and tuning cautions are in the autoscaler performance report.
Stop making one autoscaler own the whole cluster.
See how KPA shards the decision plane while application teams keep using ScaledObject.
Get Started