Kedify at KubeCon 2026: Explore autoscaling and rightsizing with our team
 All Posts
Kedify’s ROI Calculator: Explore Your Autoscaling Opportunity
by Kedify Team
June 25, 2025
The Kedify ROI Calculator helps you explore two ways autoscaling could create value: lower compute bills and recovered engineering capacity.
Updated November 2026: the calculator includes adjustable scale-down scenarios and a separate value for each benefit. Earlier saved reports need their assumptions reviewed.
Describe your workloads in three short steps
Start with annual Kubernetes compute spend and the approximate share used by workloads that can scale with demand. Describe a typical week: steady demand, quieter nights and weekends, or bursts with idle gaps. Adjust the quiet hours and how much compute is still needed during those periods. Finish with your team’s weekly scaling and reliability hours.
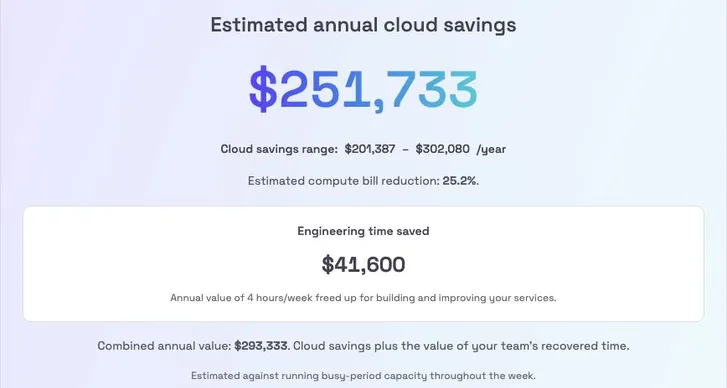
The compact wizard keeps financial results hidden until completion, then reveals a two-column estimate with two benefits and visible assumptions. Editing takes you directly back to the relevant questions, with an Update estimate action. The full result is available without email; sending a copy is optional.
See why your workload profile changes the opportunity
The reference scenario keeps busy-period capacity running all week and compares it with reducing eligible capacity during quiet hours. More quiet time, lower quiet compute needs and a larger scalable share create more opportunity.
The example uses 118 quiet hours/week: nights plus weekends around ten busy hours each weekday. At 80% scalable compute and 30% quiet compute demand, default headroom and billing assumptions model about 25% lower compute bills. These are illustrative assumptions, not customer averages or a forecast.
A lower and higher reclaimable-capacity scenario explores the same workload profile. Billing realization, engineering stays fixed. The model allows for safety headroom, minimum capacity, commitments and fixed charges. Steady demand or zero scalable share can produce zero quiet-time savings.
See two benefits separately
- Cloud cost reduction: compute spend × scalable share × quiet-time share × the busy-to-quiet compute gap × reclaimable share × billing realization.
- Engineering time saved: hours recovered × your loaded engineering cost. The result values time available for other work; it does not assume a payroll reduction.
The headline shows estimated annual cloud savings, matching the cloud reduction percentage. A separate combined value adds recovered time. Engineering hours include scaling, stability troubleshooting and SLA-related investigations, counted once. Business losses and SLA credits are not modeled, and disruption hours do not promise an uptime or SLA result.
Replace the example with measured inputs
Use billing data, workload history and operational records to refine the scenario. Keep performance headroom and validate equivalent demand during an evaluation. The calculator estimates annualized value after rollout rather than first-year cash flow.
You can use it without signing up. Save a report to email a link containing the model version and assumptions, or share the page URL after changing an input.