Kedify OTel Scaler
This tutorial shows how to autoscale your workloads using custom metrics without the need for a full-blown Prometheus. Using lightweight components such as OpenTelemetry (OTel) Collector, OTel Operator and Kedify OTel Scaler, the dedicated metrics pipeline can be setup just for the autoscaling needs. Despite the non-trivial architecture, all three components can be deployed using one single Helm Chart.
As an example workload, we will be using the vLLM runtime and Llama 3 from META.
Step 1: Deploy the AI Workload With Static Number of Replicas
Section titled “Step 1: Deploy the AI Workload With Static Number of Replicas”If you want to use some other workload than LLM, feel free to continue directly with step 3. However, make sure that your application exposes the custom metrics on port :8080 or tweak the configuration of OpenTelemetry Collector to fit your use-case.
This assumes the user to be familiar with HuggingFace and have a valid HF token.
# example of preparing PV & PVC with data on GKEkubectl apply -f - <<EOFapiVersion: v1kind: PersistentVolumeClaimmetadata:  name: "models-pvc"spec:  accessModes:    - ReadWriteOnce  resources:    requests:      storage: 20GiEOF
kubectl apply -f - <<EOFapiVersion: v1kind: Podmetadata:  name: pvc-accessspec:  containers:    - name: main      #image: shaowenchen/huggingface-cli      image: ubuntu      command: ["/bin/sh", "-ec", "sleep 15000"]      volumeMounts:        - name: models          mountPath: /mnt/models  volumes:    - name: models      persistentVolumeClaim:        claimName: models-pvcEOF
# 'ssh' to the running podkubectl exec -ti pvc-access -- bash
# download the LLM (these commands should be run in the pod)huggingface-cli login --token ${HF_TOKEN}huggingface-cli download meta-llama/meta-llama-3-8b-instruct --exclude "*.bin" "*.pth" "*.gguf" ".gitattributes" --local-dir llama3
If you have downloaded the llama 3 8B model before, you can just prepare the pv with this command instead:
# from the hostkubectl cp llama3 pvc-access:/mnt/modelsFinally, make a read-only copy that can be read from multiple pods:
kubectl apply -f - <<EOFkind: PersistentVolumeClaimapiVersion: v1metadata: name: models-pvc-clonespec: dataSource: name: models-pvc kind: PersistentVolumeClaim accessModes: - ReadOnlyMany storageClassName: csi-gce-pd resources: requests: storage: 20GiEOFWe assume the Kubernetes cluster has nodes with accelerators ready and device plugin has been successfully installed. Kedify is not opinionated about the accelerator’s vendor, however, if you happen to be using the NVIDIA accelerator, things can be much easier by using the gpu-operator. Otherwise, make sure the correct versions of drivers are installed, CUDA is present and corresponding device plugin is also running in the cluster.
We were able to run the following instance of LLama model on relatively cheap accelerator - NVIDIA L4 with following settings. dtype=float16 is important for the model to fit in the GPU’s memory (quantization), however, feel free to tune the model params to your needs. Also notice the sidecar.opentelemetry.io/inject annotation that will be later used by the OTel Operator.
apiVersion: apps/v1kind: Deploymentmetadata: name: llamaspec: selector: matchLabels: app: llama template: metadata: annotations: sidecar.opentelemetry.io/inject: 'true' labels: app: llama spec: containers: - args: - --model=/mnt/models/llama3/ - --port=8080 - --served-model-name=llama3 - --load-format=safetensors - --kv-cache-dtype=auto - --guided-decoding-backend=outlines - --tensor-parallel-size=1 - --gpu-memory-utilization=0.99 - --max-num-batched-tokens=2048 - --max-model-len=2048 - --enable-auto-tool-choice - --tool-call-parser=llama3_json - --dtype=float16 image: docker.io/vllm/vllm-openai:v0.6.4 name: main volumeMounts: - mountPath: /mnt/models/ name: model readOnly: true resources: limits: cpu: '4' memory: 16Gi nvidia.com/gpu: '1' requests: cpu: '4' memory: 8Gi nvidia.com/gpu: '1' volumes: - name: model persistentVolumeClaim: claimName: models-pvc-clone readOnly: truehelm repo add open-webui https://helm.openwebui.com/helm repo update open-webuihelm upgrade -i open-webui open-webui/open-webui --version=v5.25.0 \ --set openaiBaseApiUrl=http://llama.default.svc:8080/v1 \ --set ollama.enabled=false \ --set pipelines.enabled=false \ --set service.port=8080# first expose the svckubectl apply -f - <<EOFapiVersion: v1kind: Servicemetadata: labels: app: llama name: llamaspec: ports: - port: 8080 selector: app: llamaAsk model a question either using the Open WebUI or using CLI. Following command represents an example call to the model’s API (OpenAI streaming protocol).
(k port-forward svc/llama 8080 &> /dev/null)&curl -N -s -XPOST -H 'Content-Type: application/json' localhost:8080/v1/chat/completions \ -d '{ "model": "llama3", "messages": [ { "role": "user", "content": "sudo Write me a poem about autoscaling." } ], "stream": true, "max_tokens": 300 }'Up until now, we have a model with a single replica. It can handle multiple requests in parallel and if its KV Cache memory (integral part of each LLM that’s responsible for auto-attention mechanism) is full, the subsequent requests will go to a request queue. The size of the queue and also the capacity of the KV Cache are available as custom metrics exposed by vLLM runtime. These two or their linear combination seems to be a good indicator for the autoscaling.
Let’s demonstrate a simple example where we will be increasing or decreasing the number of replicas based on the KV Cache. We will neglect the fact that GPUs are also a limited resource and if there aren’t available accelerators in the cluster, the pods will simply end up as pending. However, Kedify KEDA can also help with scaling the GPU enabled nodes using the Cluster API.
Install everything in one shot:
cat <<VALUES |helm upgrade -i keda-otel-scaler oci://ghcr.io/kedify/charts/otel-add-on --version=v0.0.11 -f -otelOperator: enabled: trueotelOperatorCrs:- enabled: true includeMetrics: [vllm:gpu_cache_usage_perc, vllm:num_requests_waiting]VALUESThis command should install:
- Kedify OTel Scaler
- OTel Operator
- one instance of
OpenTelemetryCollectorCR with the deployment mode set to sidecar
If we inspect the configuration:
kubectl describe otelcol kedify-otel-otcWe can see the familiar configuration format for OpenTelemetry collector that sets up the receivers, exporters, transformers, processors and connectors. It is configured in a way that it will be scraping the :8080/metrics endpoint running on the same pod and sending the metrics to Kedify Scaler that has the OTLP receiver implemented. The OTel Operator will make sure that such sidecar pod with the OpenTelemetry Collector will be deployed on each pod with vLLM and our model. This is configured via the sidecar.opentelemetry.io/inject: "true" annotation. If there is a need for multiple different OTel collector sidecar within the same Kubernetes namespace, there are ways to configure this as well.
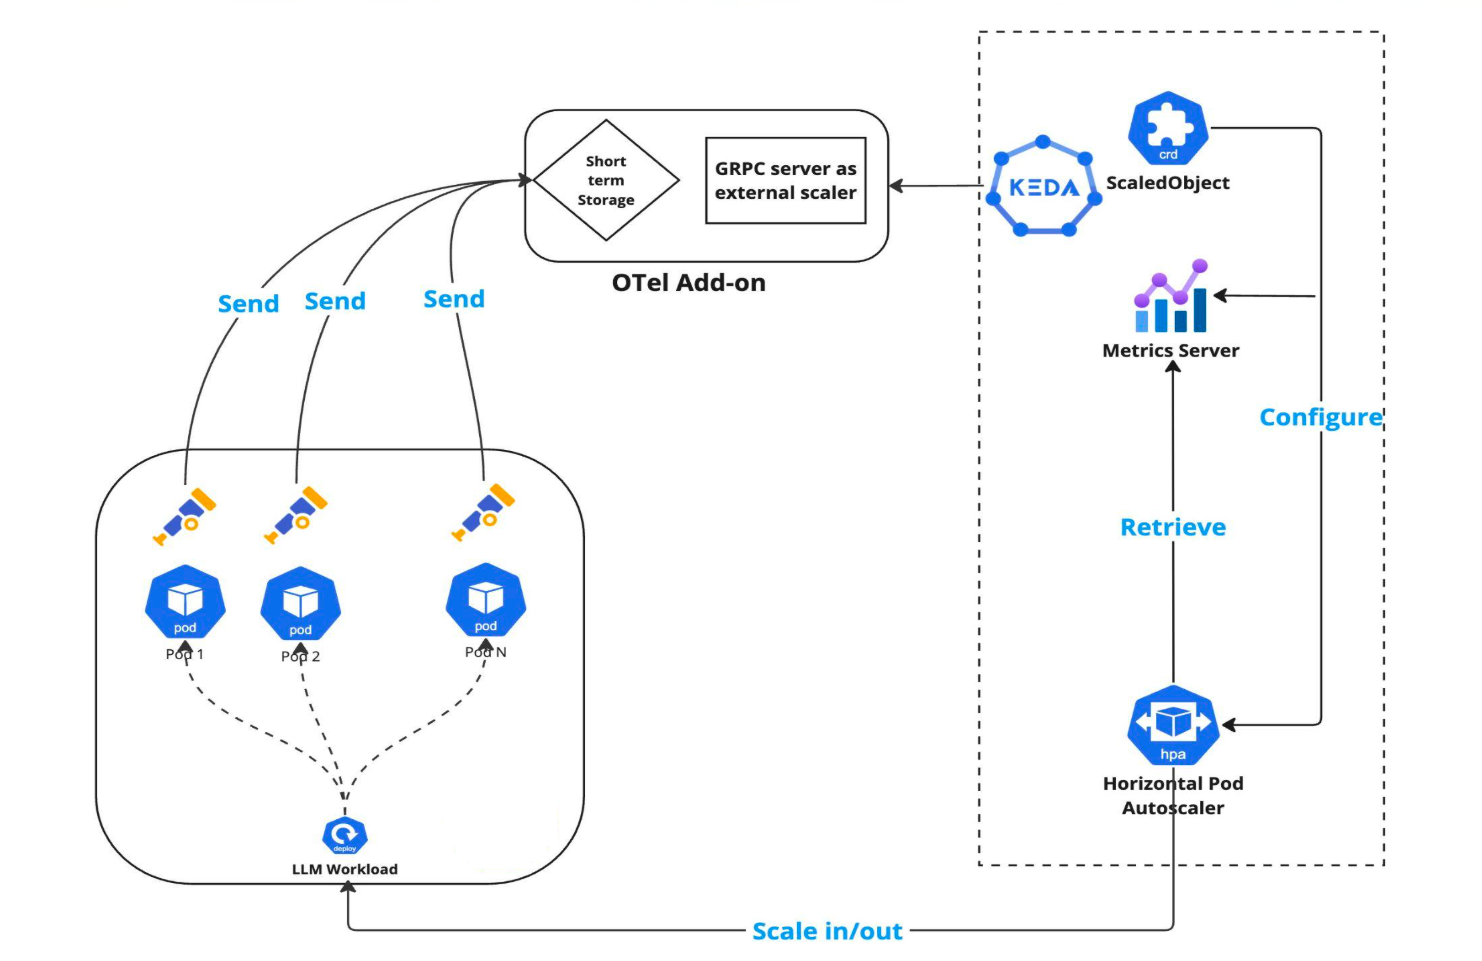
apiVersion: keda.sh/v1alpha1kind: ScaledObjectmetadata: name: modelspec: scaleTargetRef: apiVersion: apps/v1 kind: Deployment name: llama triggers: - type: kedify-otel metadata: scalerAddress: 'keda-otel-scaler.keda.svc:4318' metricQuery: 'sum(vllm:gpu_cache_usage_perc{model_name=llama3,deployment=llama})' operationOverTime: 'avg' targetValue: '0.25' minReplicaCount: 1 maxReplicaCount: 4The overall architecture then looks like this.
When using the Cluster API together with KEDA, you can also create a ScaledObject for Kubernetes nodes.
apiVersion: keda.sh/v1alpha1kind: ScaledObjectmetadata:  name: gpu-nodesspec:  scaleTargetRef:    apiVersion: cluster.x-k8s.io/v1beta1    kind: MachineDeployment    name: gpu-nodes # <-- use correct name of the machine deployment CR  triggers:    # in case of multiple triggers, max value wins    - type: external      metadata:        scalerAddress: 'keda-otel-scaler.keda.svc:4318'        metricQuery: 'sum(vllm:num_requests_waiting{model_name=llama3,deployment=llama})'        operationOverTime: 'avg'        targetValue: '50'    # This will scale the gpu nodes to 0 replicas during off hours    - type: cron      metadata:        timezone: Europe/London        start: 0 8 * * * # Set to one replica during 8 AM - 7 PM        end: 0 19 * * *        desiredReplicas: '1'
minReplicaCount: 0 maxReplicaCount: 2 advanced: horizontalPodAutoscalerConfig: behavior: scaleDown: stabilizationWindowSeconds: 1800 scaleUp: stabilizationWindowSeconds: 20This tutorial demonstrated how to plug your custom metrics into KEDA ecosystem and scale upon them. No Prometheus was installed, we used only lightweight OpenTelemetry Collector and OpenTelemetry Operator for injecting the collectors as sidecars. The operator also support different deployment modes such as:
statefulsetdaemonsetdeployment
Using the OTel Collector we could utilize different types of receivers for the metric gathering. In this tutorial we used a simple periodic scraper, but it also support a push model, metrics in OpenCensus format and other interesting receivers such as github one.
Consult the full-blown demo including the infrastructure as a code here.