Kedify Proxy Performance Tuning
Kedify Proxy is built on Envoy Proxy, it is a powerful tool that enables autoscaling based on HTTP traffic. However, to ensure optimal performance, it is essential to configure it correctly. Out of the box the proxy comes with a set of default configurations that are suitable for most use cases. However, depending on your specific requirements, you may need to adjust some settings to achieve the best performance.
This guide provides best practices and recommendations for tuning Kedify Proxy for maximum efficiency.
Step 1: Familiarize yourself with Kedify HTTP Scaler
Section titled “Step 1: Familiarize yourself with Kedify HTTP Scaler”Before diving into performance tuning, it’s important to understand how Kedify HTTP Scaler works.
Always ensure you are using the latest version of Kedify Proxy. New releases often include performance improvements, bug fixes, and new features that can enhance the overall performance of your autoscaling setup.
Analyze your application’s traffic patterns to identify the number and size of requests, response times, and other relevant metrics. This information can help you make informed decisions about how to configure Kedify Proxy for optimal performance.
Adjust Kedify Proxy resource requests and limits based on your application’s needs. Depending on your installation method, you may need to adjust the resource requests and limits in either the Agent or the Kedify Proxy helm chart.
Values used by all instances of Kedify Proxy across all namespaces are defined in the globalValues section of the Agent helm chart. The following example shows how to set resource requests and limits for Kedify Proxy in the Agent helm chart:
agent: kedifyProxy: globalValues: resources: requests: cpu: 100m memory: 128Mi limits: cpu: 200m memory: 256MiTo adjust the resource requests and limits for a Kedify Proxy in a specific namespace, you can use the namespacedValues section of the Agent helm chart:
agent: kedifyProxy: namespacedValues: namespace1: resources: requests: cpu: 100m memory: 128Mi limits: cpu: 200m memory: 256MiIf you are installing Kedify Proxy as a standalone service, you can adjust the resource requests and limits in the Kedify Proxy helm chart:
resources: requests: cpu: 100m memory: 128Mi limits: cpu: 200m memory: 256MiEnvoy upstream & downstream timeouts are set to 5 minutes by default. You can adjust these timeouts in the Kedify HTTP Addon helm chart:
interceptor: tcpConnectTimeout: '5m'Scale to zero timeout: when your application is scaled to zero and a new request comes in, Kedify Proxy will wait for the application to be ready before sending the request. This timeout is set to 20 minutes by default. You can adjust this timeout in the Kedify HTTP Addon helm chart:
interceptor: replicas: waitTimeout: '20m'When Kedify Proxy scales in or one of its pods is getting evicted to a new node, it uses preStop hook to gracefully terminate and let all active HTTP connections to complete. During this time, Kedify Proxy will not accept new connections, and the hook waits for
http.kedify-proxy.downstream_cx_active metric to report 0. The default timeout for the hook is 30 seconds with 5 seconds as an additional buffer after all connections are already drained. You can adjust this through kedify-agent helm chart:
agent: kedifyProxy: globalValues: pod: preStopHookWaitSeconds: 2 # <- additional short timeout after all connections are drained terminationGracePeriodSeconds: 60 # <- total timeout for the preStop hook namespacedValues: default: pod: preStopHookWaitSeconds: 3 # <- additional short timeout after all connections are drained in default namespace terminationGracePeriodSeconds: 90 # <- total timeout for the preStop hook in default namespaceThe terminationGracePeriodSeconds should be equal or larger than the response time of your application. If Kedify Proxy pod reaches this timeout, it will get terminated and any remaining requests will be closed with 504 Gateway Timeout error.
Envoy has a built-in circuit breaker that can help prevent cascading failures in your application. But when set too low, it can create a bottleneck in your environment. You can configure the circuit breaker in the Kedify HTTP Addon helm chart:
interceptor: envoy: upstreamRateLimiting: maxConnections: 8192 maxRequests: 8192 maxPendingRequests: 8192 maxRetries: 3Envoy has a built-in overload manager that can help prevent resource exhaustion during high traffic periods. But when set too low, it can create a bottleneck in your environment. You can configure the overload manager in the Kedify Proxy helm chart:
config: overloadManager: enabled: true refreshInterval: 0.25s maxActiveDownstreamConnections: 10000Kedify Proxy can also be autoscaled and help your infrastructure during high load periods. The following example shows how to configure autoscaling for Kedify Proxy in the Kedify Proxy helm chart:
autoscaling: enabled: true minReplicaCount: 1 maxReplicaCount: 10Envoy provides a variety of metrics that can help you monitor the performance of your autoscaling setup. These metrics can be accessed through the Envoy admin interface. Typically on port 9901/admin of the Kedify Proxy pod. You can also use a ServiceMonitor to scrape these metrics and send them to a monitoring system like Prometheus. The following example shows how to create a ServiceMonitor for an example Kedify Proxy in namespace http-server:
apiVersion: monitoring.coreos.com/v1kind: ServiceMonitormetadata: name: kedify-http-proxyspec: endpoints: - port: admin scheme: http path: /stats/prometheus namespaceSelector: matchNames: - http-server selector: matchLabels: app: kedify-proxyStep 7: How we perform load testing at Kedify
Section titled “Step 7: How we perform load testing at Kedify”We use load testing tool Locust to perform load testing on Kedify Proxy. Locust is a powerful and flexible load testing tool that allows us to simulate a large number of users and http requests to the proxy and the http application that is being scaled by Kedify.
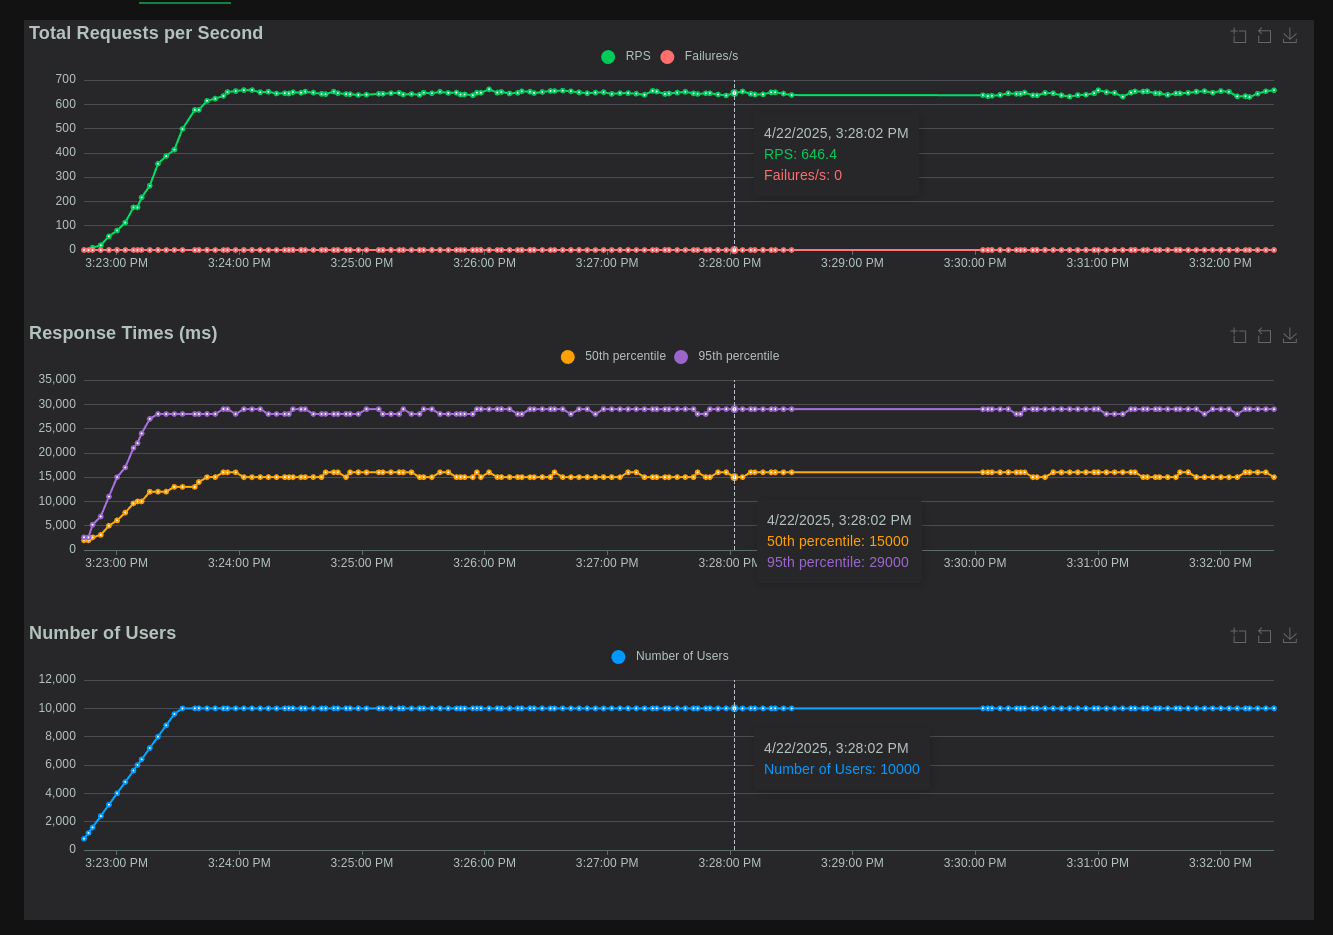
We combine statistics provided by Locust with metrics collected from Envoy and our http application. We assume that the application runs intensive calculations or waits for other services to respond. We simulate this by using a delay in the application’s response that is randomly chosen between 1 and 30 seconds. With this assumption, we expect to see the 50th percentile of the response time to be around 15 seconds and the 95th percentile to be around 29 seconds. With thousands of clients that try to connect to the application, we set the maximum number of potential application replicas to 10 and the requests per second scaling metric to a relatively low value, we use a range between 10 and 100, so that Kedify can add new application pods aggressively, as new requests are coming in. Kedify Proxy autoscaling is enabled and the maximum number of replicas is set to 10. This way we want to take the advantage of horizontal scaling to spread the load. With this high number of clients, but very limited throughput, Kedify Proxy pods cache a lot of requests and send them to the application when available.
While cpu usage is relatively low, the memory usage is high. With 10,000 clients, we expect RPS to top at around 660 requests per second (10,000 clients / 15 seconds). Very interesting metric here to monitor is upstream_rq_pending_total. Non-zero value here means that the scaled app is not able to handle the load (even with max number of replicas reached) and the Proxy is caching some number of incoming requests and can start to reject new requests. Monitoring this metric can help to fine-tune the above scaling configuration options and avert outages.
We hope we inspired you to start using autoscaling for your HTTP applications and to use performance testing tools to understand your app’s limits better. Feel free to browse through the Kedify documentation, the Kedify HTTP Scaler for more information on how to use Kedify Proxy and autoscaling in your applications.
In the mean time, we will continue to improve Kedify components, performance and documentation. If you have any questions or suggestions, please reach out to us.