HTTP Scaling for Ingress-Based Applications
This guide demonstrates how to scale applications exposed through Kubernetes Ingress based on incoming HTTP traffic. You’ll deploy a sample application with an Ingress resource, configure a ScaledObject, and see how Kedify automatically manages traffic routing for efficient load-based scaling—including scale-to-zero when there’s no demand.
For applications exposed via Ingress, Kedify automatically rewires traffic using its autowiring feature. When using the kedify-http scaler, traffic flows through:
Ingress -> kedify-proxy -> Service -> Deployment
The kedify-proxy intercepts traffic, collects metrics, and enables informed scaling decisions. When traffic increases, Kedify scales your application up; when traffic decreases, it scales down—even to zero if configured.
- A running Kubernetes cluster (local or cloud-based).
- The
kubectlcommand line utility installed and accessible. - Connect your cluster in the Kedify Dashboard.
- If you do not have a connected cluster, you can find more information in the installation documentation.
- Install hey to send load to a web application.
Deploy the following application and Ingress to your cluster:
kubectl apply -f application.yamlThe whole application YAML:
apiVersion: apps/v1kind: Deploymentmetadata: name: applicationspec: replicas: 1 selector: matchLabels: app: application template: metadata: labels: app: application spec: containers: - name: application image: ghcr.io/kedify/sample-http-server:latest imagePullPolicy: Always ports: - name: http containerPort: 8080 protocol: TCP env: - name: RESPONSE_DELAY value: '0.3'---apiVersion: v1kind: Servicemetadata: name: application-servicespec: ports: - name: http protocol: TCP port: 8080 targetPort: http selector: app: application type: ClusterIP---apiVersion: networking.k8s.io/v1kind: Ingressmetadata: name: application-ingressspec: rules: - host: application.keda http: paths: - path: / pathType: Prefix backend: service: name: application-service port: number: 8080Deployment: Defines a simple Go-based HTTP server that listens for requests, responds with a configurable delay, and exposes metrics.Service: Routes traffic to the application pods within the cluster.Ingress: Exposes the application outside the cluster using the hostnameapplication.keda.
Now, apply the following ScaledObject:
kubectl apply -f scaledobject.yamlThe ScaledObject YAML:
kind: ScaledObjectapiVersion: keda.sh/v1alpha1metadata: name: applicationspec: scaleTargetRef: apiVersion: apps/v1 kind: Deployment name: application cooldownPeriod: 5 minReplicaCount: 0 maxReplicaCount: 10 fallback: failureThreshold: 2 replicas: 1 advanced: restoreToOriginalReplicaCount: true horizontalPodAutoscalerConfig: behavior: scaleDown: stabilizationWindowSeconds: 5 triggers: - type: kedify-http metadata: hosts: application.keda pathPrefixes: / service: application-service port: '8080' scalingMetric: requestRate targetValue: '1000' granularity: 1s window: 10s trafficAutowire: ingresstype(kedify-http): Specifies the Kedify HTTP scaler for monitoring HTTP traffic.metadata.hosts(application.keda): The hostname to monitor for traffic.metadata.pathPrefixes(/): The path prefix to monitor.metadata.service(application-service): The Kubernetes Service associated with the application.metadata.port(8080): The port on the service to monitor.metadata.scalingMetric(requestRate): The metric used for scaling decisions.metadata.targetValue(1000): Target request rate; KEDA scales out when traffic meets or exceeds this value.metadata.granularity(1s): The time unit for the targetValue (requests per second).metadata.window(10s): Granularity at which the request rate is measured.metadata.trafficAutowire(ingress): Enables Kedify’s ingress autowiring feature.
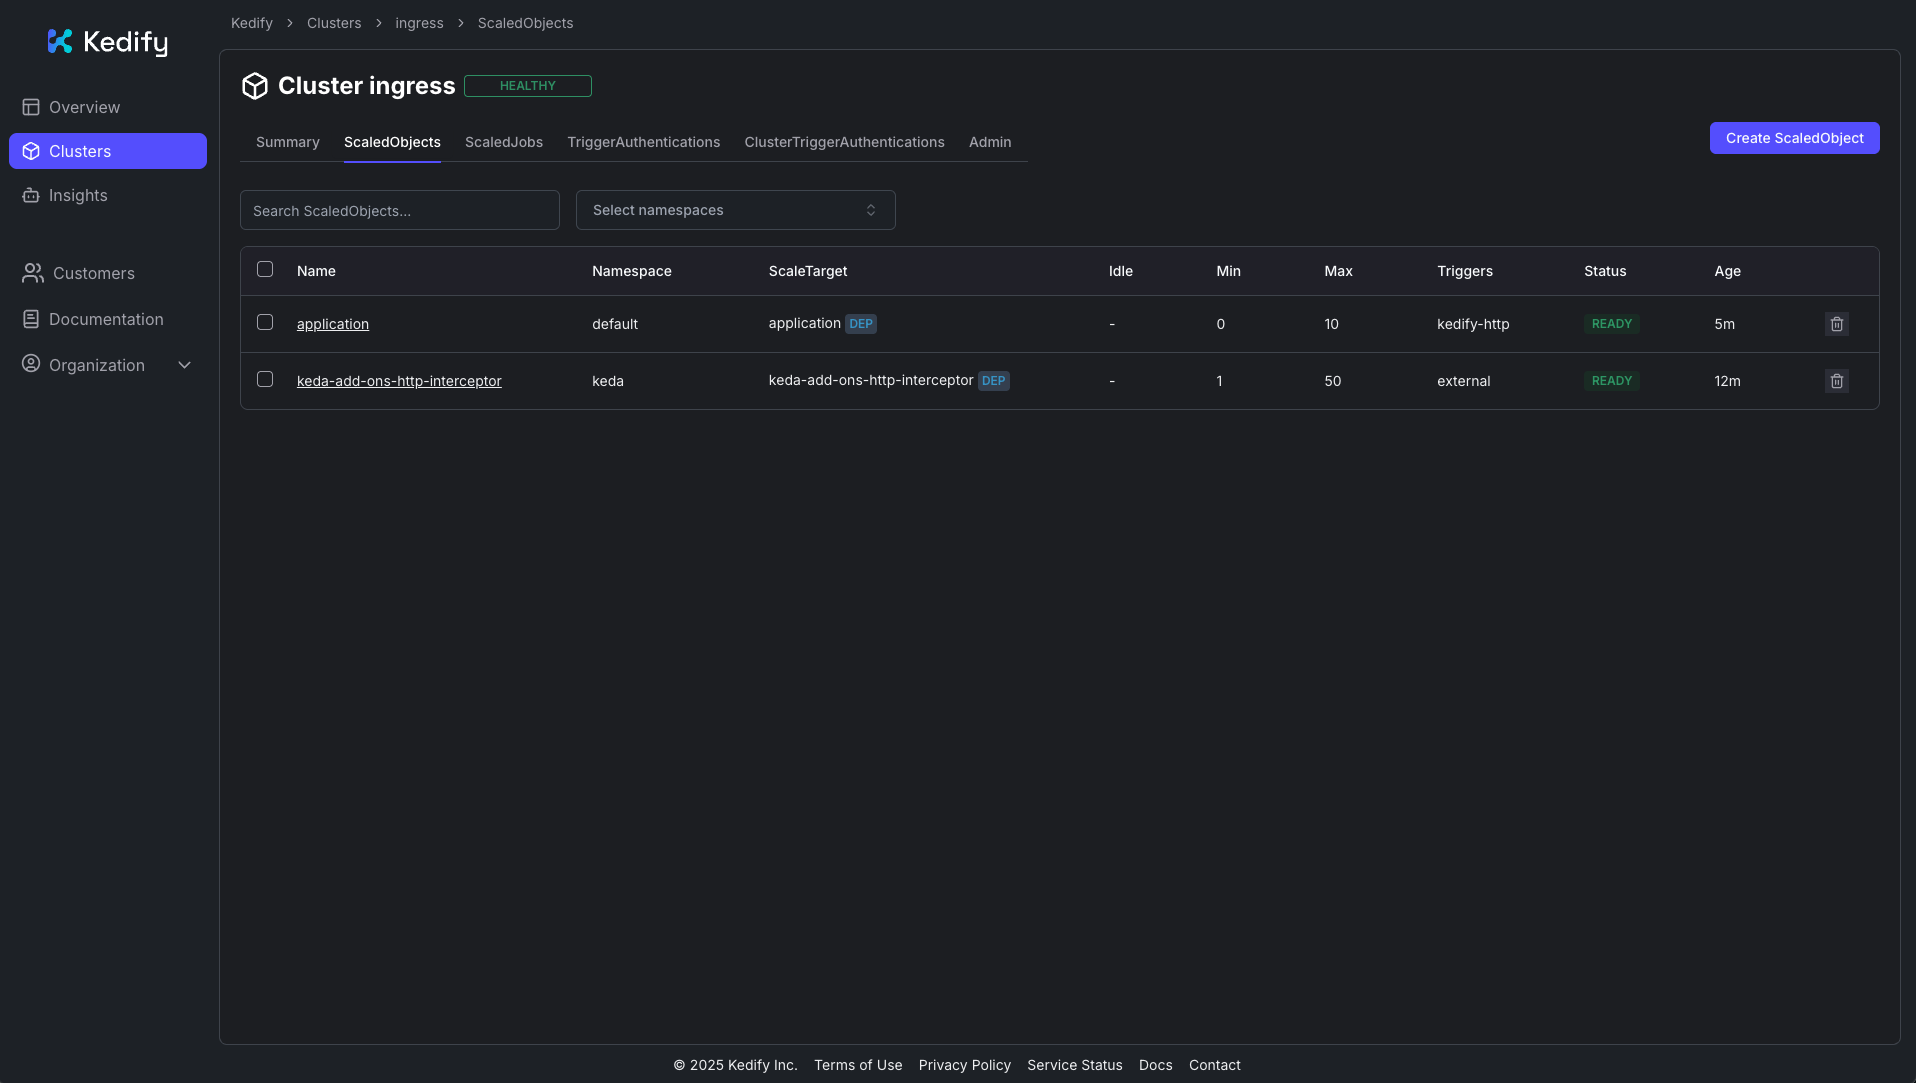
You should see the ScaledObject in the Kedify Dashboard:
First, let’s verify that the application responds to requests:
# If testing locally with k3d (if testing on a remote cluster, use the Ingress IP or domain)curl -I -H "Host: application.keda" http://localhost:9080If everything is working, you should see a successful HTTP response:
HTTP/1.1 200 OKcontent-type: text/htmldate: Wed, 16 Apr 2025 11:32:30 GMTcontent-length: 320x-envoy-upstream-service-time: 302server: envoyNow, let’s test with higher load:
# If testing locally with k3d (if testing on a remote cluster, use the Ingress IP or domain)hey -n 10000 -c 150 -host "application.keda" http://localhost:9080After sending the load, you’ll see a response time histogram in the terminal:
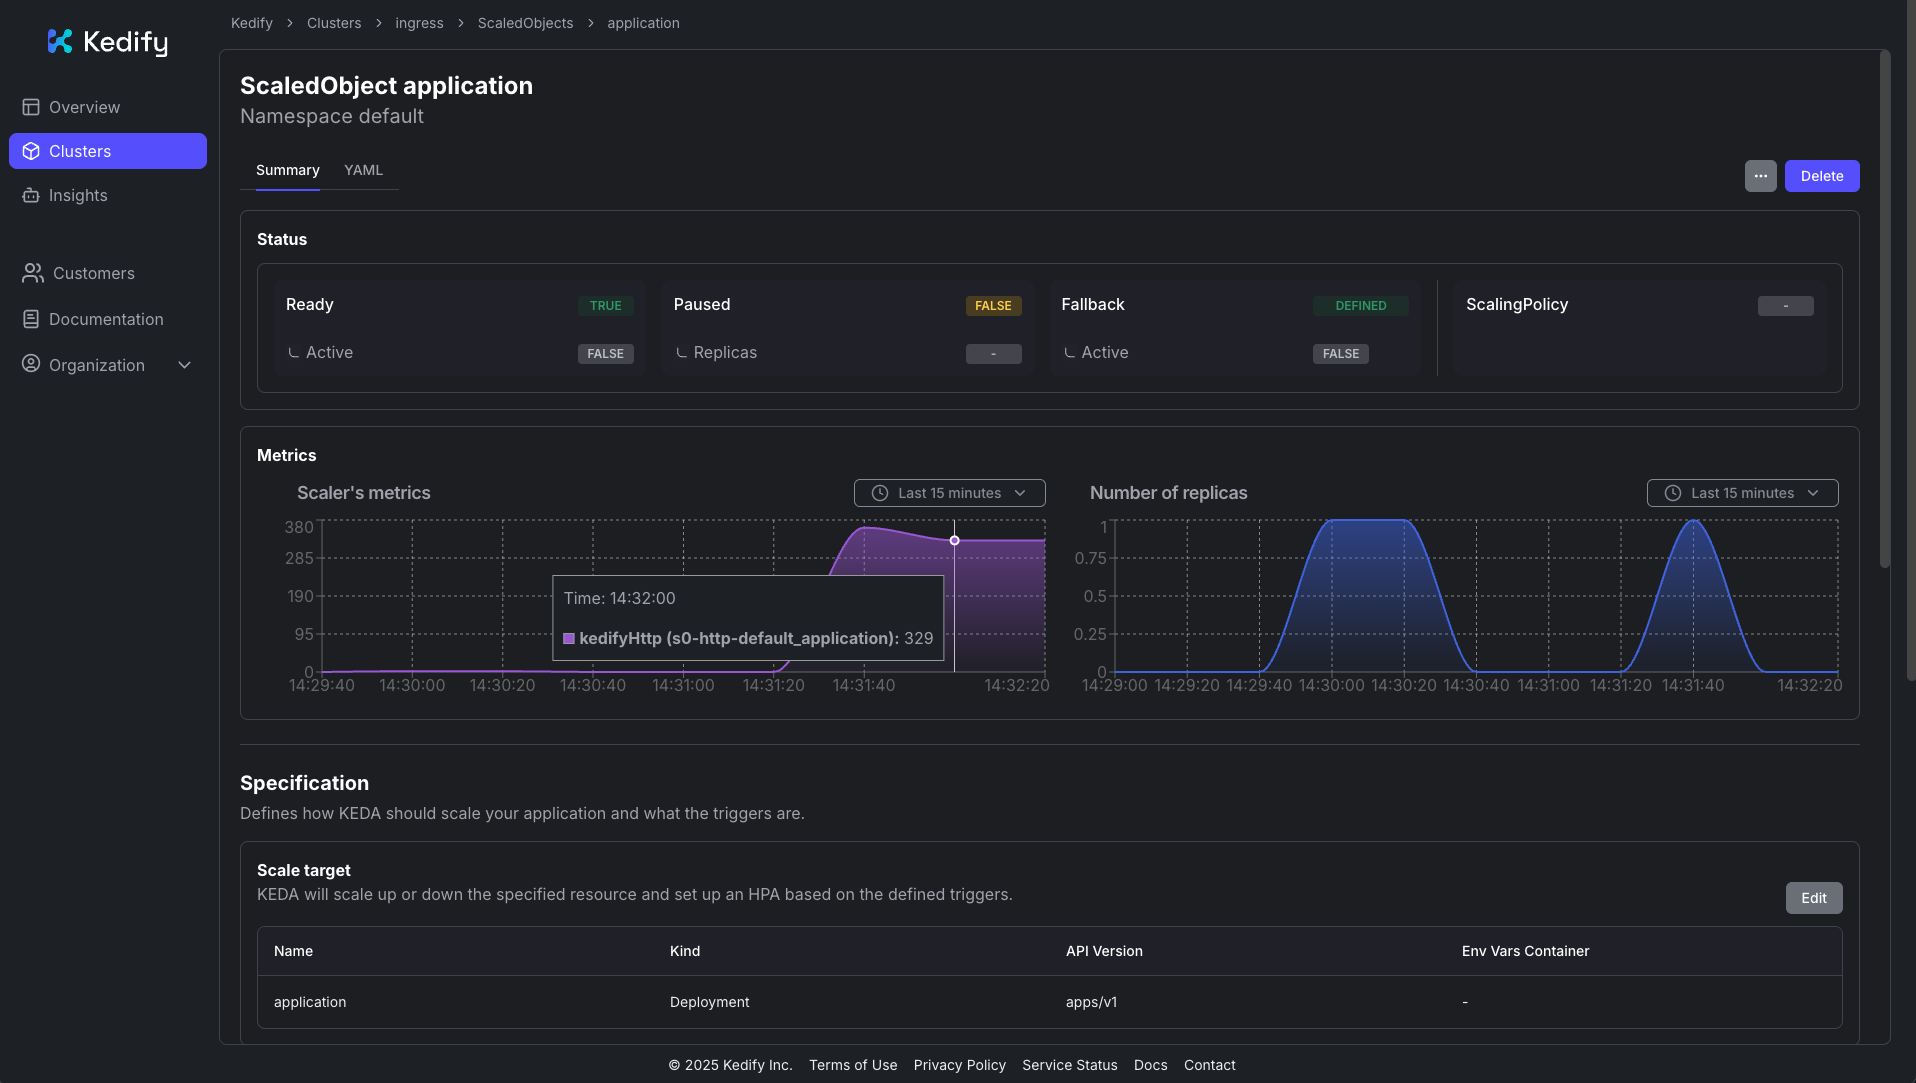
Response time histogram: 0.301 [1] | 0.498 [9749] |■■■■■■■■■■■■■■■■■■■■■■■■■■■■■■■■■■■■■■■■ 0.695 [0] | 0.892 [0] | 1.090 [0] | 1.287 [0] | 1.484 [0] | 1.681 [53] | 1.878 [0] | 2.075 [53] | 2.272 [44] |In the Kedify Dashboard, you can also observe the traffic load and resulting scaling:
You can explore the complete documentation of the HTTP Scaler for more advanced configurations, including other ingress types like Gateway API, Istio VirtualService, or OpenShift Routes.