KEDA + Kafka: 62.15% Better Peak Performance for Kubernetes Consumers

December 18, 2023
Introduction
Apache Kafka has become the de facto standard for handling large data streams, known for its high throughput and scalability. It now serves as the backbone for a range of applications, particularly in microservices where it is used to decouple microservice communication.
However, operating Kafka is not without its complexities. The challenges span across Kafka servers, producers and most notably its consumers.
Consumer challenges range from handling large volumes of incoming data during peak traffic periods to ensuring consistent throughput during low activity. This dynamic nature of incoming data influences consumer lag (measures the delay between message production and consumption), further impacting resource utilization and operational costs.
In modern cloud-native environments, Kafka consumers are increasingly deployed within Kubernetes. This setup offers benefits in scalability and deployment ease but also introduces the need for sophisticated scaling strategies that can adapt to the volatile nature of Kafka’s data streams.
This is where Kubernetes Event-Driven Autoscaling![]() (KEDA) comes into play. KEDA extends Kubernetes capabilities by allowing event-driven auto scaling. When integrated with Kafka, KEDA enables the consumer applications to scale out or in automatically based on actual workload.
(KEDA) comes into play. KEDA extends Kubernetes capabilities by allowing event-driven auto scaling. When integrated with Kafka, KEDA enables the consumer applications to scale out or in automatically based on actual workload.
This blog post demonstrates how KEDA enhances Kafka consumer performance & overall resource utilization.
Prerequisites
- Kubernetes Cluster: We will deploy KEDA & Kafka in a Kubernetes cluster. We will be using an EKS cluster, but any cluster will suffice.
- Kubectl and Helm CLI: Installed on your local machine.
Getting Started
Consumer lag in Kafka allows you to monitor the delay between the offset consumed by your consumers and the offset of the most recently added messages. When the lag is growing, it indicates that the consumers are slower than the producers. If your applications are supposed to work in near real-time, consumer lag should be a small value.
NOTE: There is no ideal value for consumer lag, it depends on the use case & what is your permissible value, but regardless it should be a small value.
Consumer lag is a direct indication of how effectively your consumers process incoming data. In our experiment, we’ll examine two distinct scenarios:
-
Consumer Lag Without KEDA (Constant Replicas): Here, the Kafka consumer application operates with a fixed number of replicas. We’ll observe the consumer lag when the Kafka producer application generates messages at a constant rate (10 messages per second). This setup will provide us with a baseline for consumer lag in a static environment.
-
Consumer Lag With KEDA (Dynamic Scaling): In this scenario, we’ll employ KEDA to dynamically scale the consumer replicas based on real-time consumer lag. By setting a threshold for consumer lag, KEDA will adjust the number of consumer replicas to efficiently process the incoming data. We’ll again have the Kafka producer generate messages at the same rate as in the first scenario.
We will measure the average consumer lag in both scenarios. This comparison will illustrate the impact of using KEDA for dynamic scaling versus a static number of consumer replicas.
To begin with, let’s proceed to set up our Kafka cluster and consumer application.
Getting Up To Speed
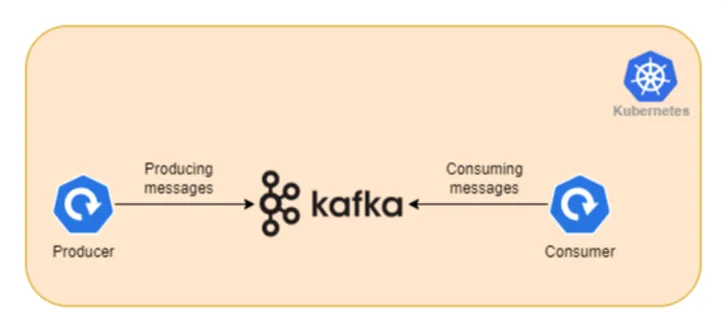
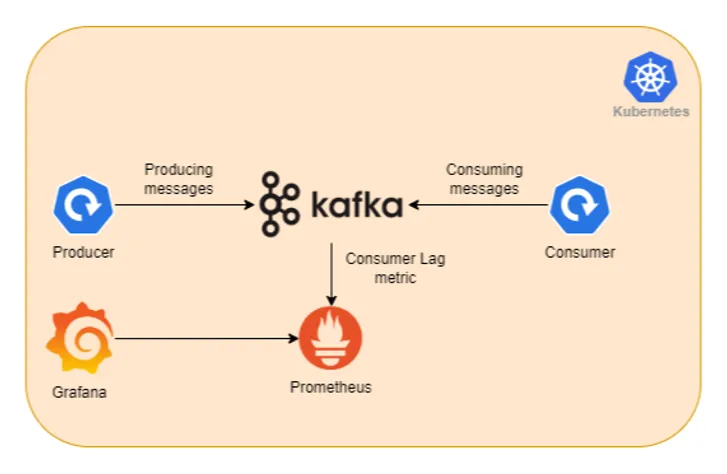
Let’s start with an initial configuration that sets up the Kafka cluster, producer & consumer application as shown in the below image.
Instructions
- Clone the Example Repository
git clone https://github.com/kedify/examples.gitcd blogs/keda_kafka_improve_performance- Setup Kafka Cluster In Kubernetes
The below command creates a Kafka namespace & installs Strimzi![]() Kafka operator in it.
Kafka operator in it.
kubectl create namespace kafkakubectl create -f 'https://strimzi.io/install/latest?namespace=kafka' -n kafkaOnce the operator is in running state, execute the below command to create a Kafka cluster. The below configuration utilizes the Kafka CRD of the Strimzi operator and creates a cluster called my-cluster.
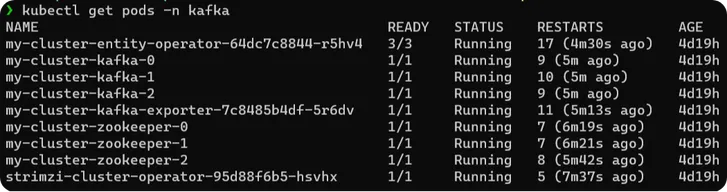
kubectl apply -f kafka.yamlThe cluster takes 2-3 minutes to be in running state, you can check status using the below command. Wait till the ready column in the output is set to true & all pods are up & running.
watch kubectl get kafka.kafka.strimzi.io/my-cluster -n kafka
- Create Kafka Topics
The below command creates a Kafka topic called my-topic by utilizing KafkaTopic CRD provided by the Strimzi operator.
kubectl apply -f topic.yaml- Setup Kafka Consumer & Producer Applications
With Kafka up and running, let’s deploy Kafka consumer and producer applications. Use the below command to deploy a consumer application.
kubectl apply -f consumer.yamlOnce the consumer is up, send messages to the Kafka server using the producer application to test the consumer.
kubectl create -f producer.yamlCheck the logs of the consumer using the below command to test if the setup is working fine.
kubectl logs -f deployment.apps/kafka-amqstreams-consumer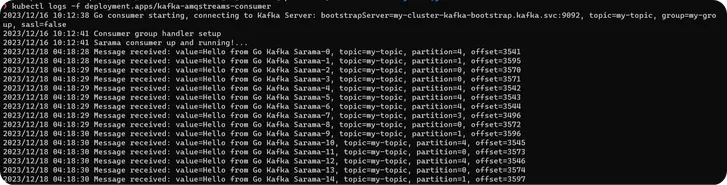
Monitoring and Optimizing Performance
With consumer & producer application up & running, Lets setup monitoring to observe the impact on Consumer Lag.
Instructions
- Prometheus Monitoring Setup
Once the Kafka cluster is up & running, install Prometheus & Grafana in the cluster using the below helm chart.
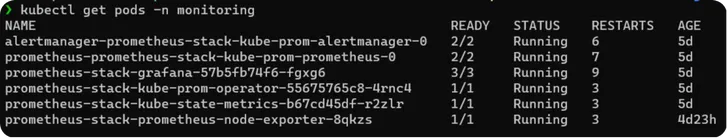
helm repo add prometheus-community [_https://prometheus-community.github.io/helm-charts_](https://prometheus-community.github.io/helm-charts)helm install prometheus-stack prometheus-community/kube-prometheus-stack -n monitoring --create-namespaceWait for all the pods to be in running state.
- Setup Pod Monitor
To get additional metrics apart from the standard JVM metrics of Kafka, we configured Strimzi Kafka resource to also set up Kafka Exporter![]() which provides additional Kafka metrics in Prometheus format.
The below command creates PodMonitor resource (a CRD of Prometheus operator) which adds Kafka Exporter as a Prometheus target.
which provides additional Kafka metrics in Prometheus format.
The below command creates PodMonitor resource (a CRD of Prometheus operator) which adds Kafka Exporter as a Prometheus target.
kubectl apply -f pod-monitor.yaml- Setup Grafana
Once the target is registered in Prometheus, access Grafana UI on the browser at http://localhost:3000/ using the below command. (Default username and passwords are admin prom-operator).
kubectl port-forward -n monitoring service/prometheus-stack-grafana 3000:80Import the Kafka Exporter![]() dashboard to view graphical visualization of additional metrics that we added while setting up Kafka.
dashboard to view graphical visualization of additional metrics that we added while setting up Kafka.
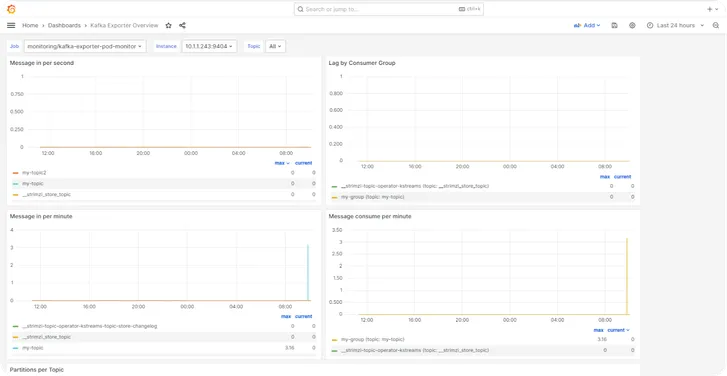
With monitoring being setups, Let’s compare the effect on consumer Lag.
Scenario 1: Without KEDA (Constant Replicas)
In this scenario we will keep consumer application replicas to one & Kafka producer application produces 10 msg / sec (5000 msg total, with 100ms delay).
With everything already setup, execute the below command to start producing messages & observe the output.
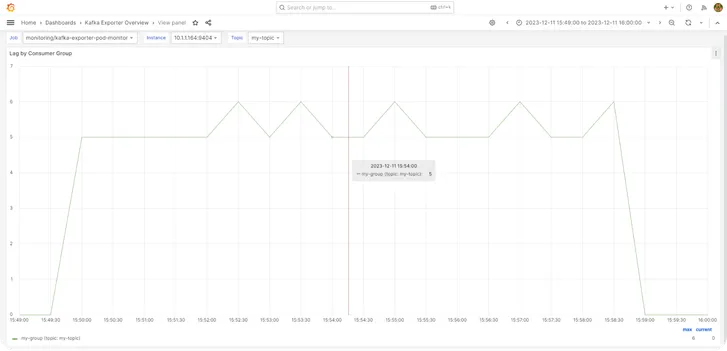
kubectl create -f producer.yamlThe below image shows the graphical representation of consumer lag over 10 minute duration. The average Consumer Lag comes out to be 5.27.
Scenario 2: With KEDA having Max Replicas set to 5
In this scenario we will use KEDA to dynamically scale consumer applications on the basis of Kafka Consumer Lag.
Instructions
1. Install KEDA
helm repo add kedacore https://kedacore.github.io/chartshelm repo updatehelm install keda kedacore/keda --namespace keda --create-namespace- Create and Deploy KEDA ScaledObject for Kafka
The below ScaledObject (a KEDA CRD) tells KEDA to monitor a Kafka topic (my-topic) and scale the deployment (kafka-amqstreams-consumer) based on the consumer lag. If the lag goes above one, KEDA will start to scale up the deployment, until it reaches a maximum of 5 replicas. It scales down when the lag is less than one, with a cooldown period of 5 seconds to avoid rapid scaling down.
apiVersion: keda.sh/v1alpha1kind: ScaledObjectmetadata: name: kafka-amqstreams-consumer-scaledobjectspec: minReplicaCount: 0 maxReplicaCount: 5 cooldownPeriod: 5 pollingInterval: 10 scaleTargetRef: name: kafka-amqstreams-consumer triggers: - type: apache-kafka metadata: topic: my-topic bootstrapServers: my-cluster-kafka-bootstrap.kafka.svc:9092 consumerGroup: my-group lagThreshold: '1' offsetResetPolicy: 'latest'Explanation of selected fields in the configuration:
- name: kafka-amqstreams-consumer - This refers to the target resource (usually a Kubernetes Deployment, ReplicaSet, etc.) that KEDA will scale. In this case, it’s kafka-amqstreams-consumer.
- triggers - This section defines the events or metrics that should trigger scaling actions.
- type: apache-kafka - This indicates that the trigger is based on Apache Kafka metrics.
- metadata: Contains specific data for the Kafka trigger
- topic: my-topic - The Kafka topic to monitor.
- bootstrapServers: my-cluster-kafka-bootstrap.kafka.svc:9092 - The address of the Kafka cluster to connect to.
- consumerGroup: my-group: - The Kafka consumer group that is consuming the topic.
- lagThreshold: ‘1’ - The lag threshold for scaling. If the lag exceeds this number, KEDA will start to scale out the application.
- offsetResetPolicy: ‘latest’ - Determines what offsets to use when the consumer group finds no initial offset in Kafka or if the current offset no longer exists on the server.
Now apply the above scaled object using the below command.
kubectl apply -f scaledobject.yamlAfter applying the above config, If there are no pending messages in Kafka (that is Consumer Lag less than 1). KEDA will scale down the consumer application to zero.
- Generate Load using Producers
kubectl create -f producer.yamlInitially we have zero replicas of consumers (because of the scale down to zero action of KEDA), as producers produce messages in Kafka the consumer lag will start to change. KEDA will trigger scale out action once the consumer lag crosses the threshold. It can reach up to a maximum of five replicas.
In Kafka, the number of consumers for a particular consumer group should not be greater than the number of partitions. That is why we have set the limit of max 5 replicas, as our cluster only has 5 partitions. Refer to this documentation
to know more.
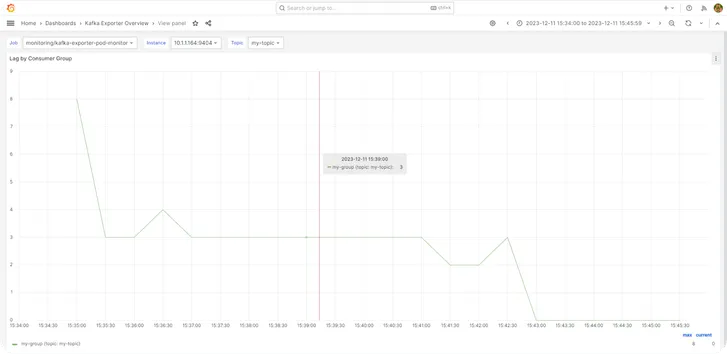
The below image shows the graphical representation of consumer lag over 10 minute duration. The average Consumer Lag comes out to be 3..
Results and Observations
To calculate the percentage change between these two averages, we use the below formula, which comes out to be 62.15%.
Given numbers
Num1 is consumer lag with KEDA
num1 = 3.25Num2 is consumer lag without KEDA
num2 = 5.27Calculating percentage change
percentage_change = ((num2 - num1) / num1) _ 100 \percentage_change = ((5.27 - 3.25) / 3.25) _ 100 \percentage_change = 62.15From this, we conclude that there is a 62.15% decrease in consumer lag when messages are consumed using KEDA.
Conclusion
In summary, integrating KEDA with Kafka in Kubernetes significantly improves consumer performance and resource efficiency, as highlighted by the 62.15% reduction in consumer lag. we encourage you to tailor these methods to your setup and share your findings. Your feedback and experiences are invaluable to our community’s learning.
For more insights into autoscaling and KEDA, get started with Kedify.