Use GCP Monitoring Metrics for Kubernetes Autoscaling with KEDA
May 29, 2024
Introduction
Kubernetes has become the de facto way for deploying microservices, owing to its autoscaling and self-healing capabilities. By default, it provides HPA (horizontal pod autoscaling) and VPA (vertical pod autoscaling) for scaling applications based on CPU and memory metrics.
Using these components is a great starting point and works well for applications under uniform load. However, in today’s cloud-native ecosystem, scaling solely on CPU and memory utilization against dynamic traffic patterns and fluctuating workloads is inadequate. This is where the native autoscaling features of Kubernetes fall short.
To accommodate this kind of unpredictable traffic or load, we need metrics that adjust in real-time and closely reflect the workload application behavior itself. For example:
— Event-Driven Applications: Consider a GCP Pub/Sub driven setup. While CPU usage might remain stable, a surge in incoming AWS Pub/Sub messages is the real metric that determines load. In such a case, autoscaling should ideally respond to the rate of incoming events or the message backlog.
— E-Commerce Transactions: In an e-commerce framework, special sale events might see a spike in order checkouts. The CPU might be unperturbed, but the genuine load can be accumulating unprocessed orders in a database queue.
These metrics offer a more responsive approach to autoscaling compared to just CPU and memory based autoscaling. In this blog, we’ll explore configuring autoscaling for kubernetes applications using metrics stored in GCP Stack Driver.
For foundational understanding about KEDA, refer this blog post.
Pre-Requisites
— A project created with Google Cloud Platform (GCP)
— If running on a local machine, these tools need to be installed:
Kubectl: It is a command-line tool that allows you to run commands against Kubernetes clusters. To install it, follow the instructions in the official Kubernetes documentation![]() .
.
Helm: It is a package manager for Kubernetes that simplifies the deployment of applications and services. To install Helm, refer to the Helm installation guide![]() .
.
Gcloud CLI: A CLI to interact with Google Cloud services. To install, please refer to this guide![]() .
.
(For quick access, Google Cloud Shell can be used from the cloud console. Which has the above tools pre-installed.)
Vegeta: HTTP load testing tool. To install, refer to this guide![]() .
.
Application Overview
We have a web server application written in Golang that exposes some APIs for consumption. It is deployed using Kubernetes with no autoscaling configured.
The application is resource intensive, during heavy load we observe resource (CPU, memory) saturation. This causes the application to respond with 500 status code after a certain number of API calls.
To observe this behavior, the application is instrumented to send 500_error_rate metric to Stack Driver (now part of GCP’s monitoring API). Let’s see this in action.
Deploying and Verifying Application Behavior
-
Create a GKE Standard Cluster
In the below command, replace PROJECT_ID with your project ID and LOCATION with your preferred location (you can default to us-central1).
This will create a cluster with 1 node pool (having 3 nodes in it) and workload identity feature enabled.
# create clustergcloud container clusters create "default-cluster" --workload-pool=PROJECT_ID.svc.id.goog --region LOCATION --machine-type "e2-medium" --disk-type "pd-standard" --disk-size "100" --num-nodes 1# Configure kubeconfiggcloud container clusters get-credentials default-cluster --location LOCATION# Verify accesskubectl get ns -
Create Service Accounts
We will configure the workload identity feature of GKE, for the application to access GCP services (monitoring APIs) without requiring any credentials.
We will create a GCP service account with the monitoring admin role. This service account will bind with the GKE service account, such that the pod running with the given GKE service account can access APIs without credentials.
In the below command, replace PROJECT_ID with your project ID.
# Create GCP service accountgcloud iam service-accounts create stackdriver-web-server --project=PROJECT_ID# Attach monitoring.admin role to GCP service accountgcloud projects add-iam-policy-binding PROJECT_ID --member "serviceAccount:stackdriver-web-server@PROJECT_ID.iam.gserviceaccount.com" --role "roles/monitoring.admin"# Bind GCP service account with GKE service account(will be created in next-step)gcloud iam service-accounts add-iam-policy-binding stackdriver-web-server@PROJECT_ID.iam.gserviceaccount.com --role roles/iam.workloadIdentityUser --member "serviceAccount:PROJECT_ID.svc.id.goog[default/web-server]" -
Clone the Example Repository
git clone https://github.com/kedify/examples.gitcd examples/blogs/keda_gcp_stackdriver/program -
Deploy Web Server Application
In the deploy.yaml file replace PROJECT_ID (at 2 places) with your project ID, then execute the below command.
kubectl apply -f deploy.yamlWait for the application to get into a running state.
-
Get Public IP assigned to the load balancer
kubectl get service web-serverIf the status of EXTERNAL-IP is pending wait for the provisioning of cloud load balancer to complete.
-
Generate Load on Web Server
In the below command, replace PUBLIC_IP with the load balancer public IP. This will send 100 HTTP requests to our web server.
echo "GET http://PUBLIC_IP:1323/" | vegeta attack -rate=100 -duration=1s -keepalive false -connections 1 | vegeta report --every 1s -
Result Analysis
From the below result, we can identify that 50% of requests failed with a 500 status code error. This failure is due to the saturation of resources.
Requests [total, rate, throughput] 100, 100.90, 32.60Duration [total, attack, wait] 1.533873128s, 991.125504ms, 542.747624msLatencies [mean, 50, 95, 99, max] 531.583998ms, 522.998243ms, 1.135576209s, 1.210611327s, 1.221199078sBytes In [total, mean] 3994, 39.94Bytes Out [total, mean] 0, 0.00Success [ratio] 50.00%Status Codes [code:count] 200:50 500:50Error Set:500 Internal Server Error
Note: A service can give 500 status codes for various reasons, in this blog we are using a web server which has a resource saturation problem. But in a practical scenario, this has to be derived from observability results.
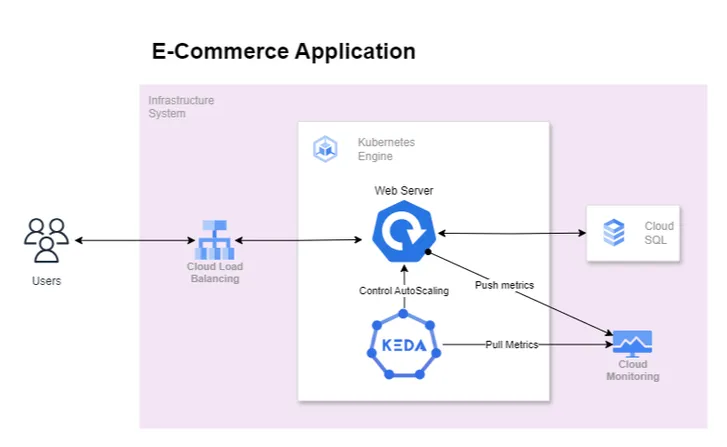
Introducing KEDA For Autoscaling
The above diagram depicts our revised architecture in which KEDA is introduced to scale application based on error rate indirectly tackling the resource saturation problem. We expect that as the error rate increases KEDA will kick in auto-scale the application when the error rate crosses a specific threshold.
Installing KEDA
In the below command, replace PROJECT_ID with your project ID.
helm repo add kedacore https://kedacore.github.io/chartshelm repo updatehelm upgrade -i keda kedacore/keda --namespace keda --create-namespace --set "serviceAccount.annotations.iam\.gke\.io/gcp-service-account=stackdriver-web-server@PROJECT_ID.iam.gserviceaccount.com"Wait for all pods to get into the running state.
kubectl get pods -n kedaMove on to the next step once everything is running.
KEDA & GCP Authentication
To scale based on the GCP Stack Driver, KEDA requires authentication credentials of the GCP project which has appropriate permissions to operate on the Stack Driver.
KEDA provides a few secure patterns to manage authentication flows:
-
Directly Configure authentication per ScaledObject using Configmap or Secret
-
Re-use per-namespace credentials with TriggerAuthentication
TriggerAuthentication allows you to describe authentication parameters separate from the ScaledObject and the deployment containers. It also enables more advanced methods of authentication like “workload identity”, external secrets, authentication re-use or allowing IT to configure the authentication.
-
Re-use global credentials with ClusterTriggerAuthentication
Each TriggerAuthentication is defined in one namespace and can only be used by a ScaledObject in that same namespace. For cases where you want to share a single set of credentials between scalers in many namespaces, you can instead create a ClusterTriggerAuthentication. As a global object, this can be used from any namespace.
In our case we will be using TriggerAuthentication at namespace level. The authentication provider to use with TriggerAuthentication depends where the application is running.
Application Location
-
Application is running outside of GCP network
In this condition, we can use Secret provider
 to store GCP credentials such as service-account.json in a Kubernetes Secret.
 -
Application is running inside of GCP network
We can use the Secret provider approach as mentioned earlier, but when your applications are running inside the GCP network the best practice is to use service accounts to obtain temporary credentials. In this case, we will be using GCP Workload Identity
.The below diagram depicts, how authorization will work in our case
Steps & Instructions
-
Register KEDA Service Account with GCP Service Account
In the below command, replace PROJECT_ID with your project ID.
gcloud iam service-accounts add-iam-policy-binding stackdriver-web-server@PROJECT_ID.iam.gserviceaccount.com --role roles/iam.workloadIdentityUser --member "serviceAccount:PROJECT_ID.svc.id.goog[keda/keda-operator]" -
Configuring Scaled Object
In the scaled-object.yaml replace PROJECT_ID with your project ID.
apiVersion: keda.sh/v1alpha1kind: TriggerAuthenticationmetadata:name: keda-trigger-auth-gcp-credentialsspec:podIdentity:provider: gcp---apiVersion: keda.sh/v1alpha1kind: ScaledObjectmetadata:name: gcp-stackdriver-scaledobjectspec:scaleTargetRef:name: web-servertriggers:- type: gcp-stackdriverauthenticationRef:name: keda-trigger-auth-gcp-credentialsmetadata:projectId: PROJECT_IDfilter: 'metric.type="custom.googleapis.com/500_error_rate"'targetValue: '30'alignmentPeriodSeconds: '60'alignmentAligner: meanalignmentReducer: sumThe ScaledObject configuration is defined as follows:
-
scaleTargetRef: This section specifies the target resource that KEDA should scale. In this case:
— name: web-server - This indicates that KEDA is configured to scale a resource namedweb-server. This could be a Kubernetes Deployment, StatefulSet. -
triggers: This section defines the conditions under which scaling should occur. Each trigger can be set up based on different types of metrics or event sources. Here, the configuration specifies a single trigger:
— type: gcp-stackdriver - This specifies that the scaling is based on metrics from Google Cloud Platform’s Stackdriver (now called Google Cloud Monitoring).
— authenticationRef:
— name: keda-trigger-auth-gcp-credentials - This refers to a Kubernetes secret or a similar resource that contains authentication details necessary for KEDA to connect to GCP Stackdriver.
— metadata: Contains detailed settings specific to the gcp-stackdriver trigger:
— projectId : PROJECT_ID - This should be replaced with the actual Google Cloud Project ID where the metrics are being collected.
— filter: ‘metric.type=“custom.googleapis.com/500_error_rate”’ - This is the metric filter used to query Stackdriver. It looks for a custom metric named 500_error_rate which likely tracks the rate of HTTP 500 errors.
— targetValue: “30” - This is the target value for the metric that triggers scaling. For example, if the 500_error_rate exceeds 30, it could trigger a scale-out action.
— alignmentPeriodSeconds: “60” - This specifies the alignment period for the metric in seconds. This is the duration over which the metric data is aggregated.
— alignmentAligner: mean - This indicates that the metric values are averaged over the alignment period.
— alignmentReducer: sum - This specifies how data from multiple time series that match the filter are combined. Here, the values are summed up across the period specified.\For detailed information on configuring ScaledObject in KEDA, refer to the official KEDA documentation
.
-
-
Create Scaled Object
In the deploy.yaml file replace PROJECT_ID with your project ID, then execute the below command.
kubectl apply -f scaled-object.yaml -
Generate Load
In the below command, replace PUBLIC_IP with the load balancer public IP. This will send 100 HTTP requests every second at a periodic interval of 10 seconds.
bash load.sh -
Result Analysis
During the 1st two intervals, the success ratio remained constant with 1 replica. As the error rate increased KEDA started scaling applications, whose resultant action can be seen by improved success ratio.
❯ bash load.shRequests [total, rate, throughput] 100, 100.90, 32.60Duration [total, attack, wait] 1.533873128s, 991.125504ms, 542.747624msLatencies [mean, 50, 95, 99, max] 531.583998ms, 522.998243ms, 1.135576209s, 1.210611327s, 1.221199078sBytes In [total, mean] 3994, 39.94Bytes Out [total, mean] 0, 0.00Success [ratio] 50.00%Status Codes [code:count] 200:50 500:50Error Set:500 Internal Server ErrorAttack for completed, iteration 1/20.Requests [total, rate, throughput] 100, 101.01, 25.31Duration [total, attack, wait] 2.015022284s, 990.024693ms, 1.024997591sLatencies [mean, 50, 95, 99, max] 540.398507ms, 1.008526156s, 1.105414786s, 1.230161211s, 1.235069481sBytes In [total, mean] 4039, 40.39Bytes Out [total, mean] 0, 0.00Success [ratio] 51.00%Status Codes [code:count] 200:51 500:49Error Set:500 Internal Server ErrorAttack for completed, iteration 2/20.Requests [total, rate, throughput] 100, 101.04, 48.62Duration [total, attack, wait] 2.056655297s, 989.735319ms, 1.066919978sLatencies [mean, 50, 95, 99, max] 1.071611898s, 1.046408091s, 1.250479s, 1.28644823s, 1.296641423sBytes In [total, mean] 5987, 59.87Bytes Out [total, mean] 0, 0.00Success [ratio] 70.00%Status Codes [code:count] 200:70 500:30Error Set:Attack for completed, iteration 3/20.Requests [total, rate, throughput] 100, 101.04, 45.69Duration [total, attack, wait] 2.166582685s, 989.747123ms, 1.176835562sLatencies [mean, 50, 95, 99, max] 1.060029281s, 1.037487826s, 1.211447016s, 1.250660058s, 1.26766328sBytes In [total, mean] 5948, 59.48Bytes Out [total, mean] 0, 0.00Success [ratio] 80.00%Status Codes [code:count] 200:80 500:20Error Set:500 Internal Server ErrorAttack for completed, iteration 4/20.Requests [total, rate, throughput] 100, 100.93, 45.01Duration [total, attack, wait] 1.999666891s, 990.817295ms, 1.008849596sLatencies [mean, 50, 95, 99, max] 932.347941ms, 1.01728488s, 1.096900389s, 1.135570811s, 1.139875131sBytes In [total, mean] 5594, 55.94Bytes Out [total, mean] 0, 0.00Success [ratio] 98.00%Status Codes [code:count] 200:98 500:2Error Set:500 Internal Server ErrorAttack for completed, iteration 6/20.Requests [total, rate, throughput] 100, 100.99, 47.66Duration [total, attack, wait] 1.951267076s, 990.148768ms, 961.118308msLatencies [mean, 50, 95, 99, max] 953.814755ms, 1.016928642s, 1.059658518s, 1.075381866s, 1.084935868sBytes In [total, mean] 5712, 57.12Bytes Out [total, mean] 0, 0.00Success [ratio] 93.00%Status Codes [code:count] 200:93 500:7Error Set:500 Internal Server ErrorAttack for completed, iteration 8/20.Requests [total, rate, throughput] 100, 101.00, 48.90Duration [total, attack, wait] 2.044873866s, 990.054865ms, 1.054819001sLatencies [mean, 50, 95, 99, max] 1.044694019s, 1.025950457s, 1.091682248s, 1.529444546s, 1.935019526sBytes In [total, mean] 5987, 59.87Bytes Out [total, mean] 0, 0.00Success [ratio] 100.00%Status Codes [code:count] 200:100Error Set:Attack for completed, iteration 10/20....Load test completed. -
Clean Up
kubectl delete -f deploy_sa.yamlkubectl delete -f scaled-object-sa.yamlgcloud container clusters delete "default-cluster" --region LOCATION
Exploring Other GCP Scalers with KEDA
Apart from GCP Stack Driver (now part of Cloud Monitoring API), KEDA has built-in scalers for:
— GCP Storage![]() : This specification describes the
: This specification describes the gcp-storage scaler, which scales Kubernetes workloads based on the count of objects in a given Google Cloud Storage (GCS) bucket.
— GCP Cloud Tasks![]() : The Google Cloud Platform (GCP) Cloud Tasks trigger allows you to scale based on the number of tasks queued in you queue.
: The Google Cloud Platform (GCP) Cloud Tasks trigger allows you to scale based on the number of tasks queued in you queue.
— GCP Pub/Sub![]() : The Google Cloud Platform (GCP) Pub/Sub trigger allows you to scale based on any metrics from your Pub/Sub subscription or topic, such as number of messages or oldest unacked message age, etc.
The Google Cloud Platform (GCP) Pub/Sub trigger allows you to scale based on any metrics from your Pub/Sub subscription or topic, such as number of messages or oldest unacked message age, etc.
: The Google Cloud Platform (GCP) Pub/Sub trigger allows you to scale based on any metrics from your Pub/Sub subscription or topic, such as number of messages or oldest unacked message age, etc.
The Google Cloud Platform (GCP) Pub/Sub trigger allows you to scale based on any metrics from your Pub/Sub subscription or topic, such as number of messages or oldest unacked message age, etc.
Conclusion
Making use of the GCP Monitoring API with KEDA is a good solution for managing autoscaling in response to real-time metrics that mirror actual application demands. This integration addresses the limitations of traditional Kubernetes autoscaling methods, providing a more dynamic and responsive environment for deploying microservices. By using context-specific metrics such as error rates or specific event queues organizations can ensure that their deployments are resilient under varying loads.
Furthermore, the flexibility offered by KEDA’s authentication methods, including the sophisticated use of GCP’s Workload Identity, enhances security and simplifies the management of credentials.
We are excited to announce the public beta launch of Kedify, which simplifies KEDA-powered autoscaling. We invite you to try out this public beta and experience the enhanced capabilities firsthand. Please take a moment to try our free beta![]() , it only takes ~90 seconds and we are eager to hear your feedback.
, it only takes ~90 seconds and we are eager to hear your feedback.