Autoscaling Dapr Applications
December 11, 2024
Dapr
One of the possible benefits of using Dapr in a Kubernetes environment is its potential integration with autoscaling mechanisms, such as KEDA
(Kubernetes Event-driven Autoscaling).
Autoscaling enables microservices to dynamically adjust their resource allocation based on incoming traffic or other metrics, ensuring optimal performance while minimizing costs.
This can be achieved because Dapr uses the sidecar model and each sidecar exposes the metrics in a unified format that can be later used for KEDA.
In this blog post, we will explore how to leverage Dapr’s service invocation pattern to enable autoscaling in your microservice architecture. However, similar approach can be used for scaling the pub/sub pattern or even the Actor model they also support.
Example Dapr Application
In this example we will set up a microservice architecture using Dapr middleware. There will be two microservices:
one written in Node.js called nodeapp and one written in Python called pythonapp. These services are based on an
upstream example,
where the Python app calls the Node app using the service invocation pattern.
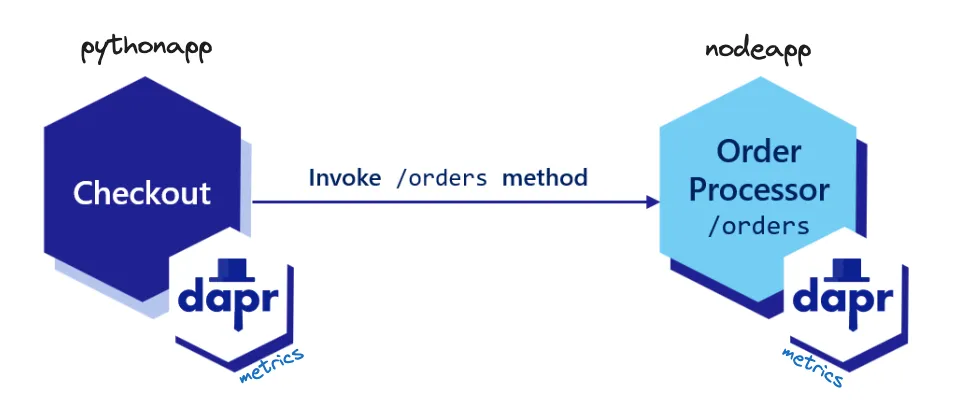
Both workloads run daprd in a sidecar container, which also exposes metrics. We have modified the daprd and its
mutating webhook (dapr-sidecar-injector) to push metrics to our OTEL collector. These metrics use OpenCensus,
so we need to configure the OTEL collector to accept metrics through the opencensus receiver.
KEDA OTEL Scaler
By utilizing the otel-add-on, we create an API bridge between KEDA’s external push contract and the OTEL protocol.
While it’s possible to use Prometheus, Datadog, or similar metrics stores as intermediate solutions, opting for a direct integration with OpenTelemetry offers benefits in speed, latency, and stability. Moreover, it simplifies our system by eliminating the need for an additional component. For more details, refer to our previous blog post.

Integration of Dapr with KEDA
- Create a K8s Cluster
For this demo, we will be using k3d that can create lightweight k8s clusters, but any k8s cluster will work. For installation of k3d, please consult k3d.io.
# create cluster and expose internal (NodePort) 31198 as port on host - 8080# it's not required to use nodeport, but this can makes app accessible w/o port forwardk3d cluster create dapr-demo -p "8080:31222@server:0"- Install Dapr
Install dapr into current k8s cluster. This require dapr cli to be installed.
# arch -arm64 brew install dapr/tap/dapr-clidapr init -k --dev --runtime-version 1.14.4dapr status -k- Change the default Dapr image of sidecar container
Dapr uses OpenCensus for metrics and by default the metrics are only exposed in plain text format using http for scraping.
In order to decrease the delay we need to migrate from pull model to push model for metric gathering.
Make sure our version of Dapr is used. This is needed for
daprd sidecars to push the metrics to our Kedify otel-add-on.
kubectl set env deployments.apps -n dapr-system dapr-sidecar-injector SIDECAR_IMAGE=docker.io/jkremser/dapr:test SIDECAR_IMAGE_PULL_POLICY=Alwayskubectl set image deploy/dapr-sidecar-injector -n dapr-system dapr-sidecar-injector=jkremser/dapr-injector:testkubectl rollout status -n dapr-system deploy/dapr-sidecar-injector- Install the Example Applications
kubectl apply -f https://raw.githubusercontent.com/dapr/quickstarts/refs/tags/v1.14.0/tutorials/hello-kubernetes/deploy/node.yamlkubectl apply -f https://raw.githubusercontent.com/dapr/quickstarts/refs/tags/v1.14.0/tutorials/hello-kubernetes/deploy/python.yamlNow we have two microservices one calling the other one via Dapr middleware.
- Install the Addon
Deploy the scaler and OTEL collector that forwards one whitelisted metric: runtime_service_invocation_req_recv_total. You can spot the difference in
the metric name. This is because of the fact how OTEL collector internally works with the metrics, you can check the details when looking into OTEL collector
logs.
cat <<VALUES | helm upgrade -i kedify-otel oci://ghcr.io/kedify/charts/otel-add-on --version=v0.0.4 -f -opentelemetry-collector: alternateConfig: processors: filter/ottl: error_mode: ignore metrics: metric: # drop all other metrics that are not whitelisted here - | name != "runtime/service_invocation/req_recv_total" and instrumentation_scope.attributes["app_id"] != "nodeapp" and instrumentation_scope.attributes["src_app_id"] != "pythonapp" service: pipelines: metrics: processors: [filter/ottl]VALUESMetric runtime_service_invocation_req_recv_total is described in the Dapr docs
and we identified it as a good candidate for scaling.
- Patch Dapr Apps
Remember we have to use own Dapr images because the upsteam one is not able to push the metrics to OTEL collector. This has to be also enabled on the application level using annotations. So we need to patch the deployments
# use our tweaked version, until https://github.com/dapr/dapr/issues/7225 is donekubectl patch svc nodeapp --type=merge -p '{"spec":{"type": "NodePort","ports":[{"nodePort": 31222, "port":80, "targetPort":3000}]}}'kubectl patch deployments.apps pythonapp nodeapp --type=merge -p '{"spec":{"template": {"metadata":{"annotations": { "dapr.io/enable-metrics":"true", "dapr.io/metrics-port": "9090", "dapr.io/metrics-push-enable":"true", "dapr.io/metrics-push-endpoint":"otelcol:55678" }}}}}'- Install KEDA by Kedify
helm repo add kedify https://kedify.github.io/chartshelm repo update kedifyhelm upgrade -i keda kedify/keda --namespace keda --create-namespace --version v2.16.0-1- Wait for All the Deployments
for d in nodeapp pythonapp otelcol otel-add-on-scaler ; do kubectl rollout status --timeout=300s deploy/${d}donefor d in keda-admission-webhooks keda-operator keda-operator-metrics-apiserver ; do kubectl rollout status --timeout=300s deploy/${d} -nkedadone- Create ScaledObject
apiVersion: keda.sh/v1alpha1kind: ScaledObjectmetadata: name: dapr-nodeappspec: scaleTargetRef: name: nodeapp triggers: - type: kedify-otel metadata: scalerAddress: 'keda-otel-scaler.default.svc:4318' # rate of change of this counter # it gets increased with each call of the service invocation from app pythonapp -> app nodeapp metricQuery: 'sum(runtime_service_invocation_req_recv_total{app_id="nodeapp",src_app_id="pythonapp"})' operationOverTime: 'rate' targetValue: '1' clampMax: '20' minReplicaCount: 1You can create the ScaledObject for nodeapp that also contains more aggressive timeouts for HPA by issuing:
kubectl apply -f https://raw.githubusercontent.com/kedify/otel-add-on/74751f1f89/examples/dapr/nodeapp-so-v1.yamlScaling Behavior
Each replica of the pythonapp microservice makes a call to the nodeapp microservice every second. Check the following part of the ScaledObject configuration:
metricQuery: 'sum(runtime_service_invocation_req_recv_total{app_id="nodeapp",src_app_id="pythonapp"})'operationOverTime: 'rate'- The runtime_service_invocation_req_recv_total metric increments each time the
pythonappcallsnodeapp. - One of the metric dimensions is the pod identity, meaning each pod exposes these metrics with its label attached.
- Similar to
PromQL, if not all dimensions are specified, multiple metric series will be returned. - The OTEL scaler calculates the rate over a one-minute window (default). This should be
1, as we are calling the API every second, so the counter increments by one each second. - If multiple metric series are present, the sum is applied to aggregate the values. For example, if there are three
producer pods, the total will be
3. - The
targetValuewas set to1, indicating that one replica of nodeapp can handle this value. This ensures replica parity between the two services. - If
targetValuewas set to2, it would indicate that if we scale pythonapp (the producer) toNreplicas, it would result innodeapp(the consumer) being scaled toN/2replicas.
Scale the caller microservice to 3 replicas and observe the node app:
kubectl scale deployment pythonapp --replicas=3This should lead to nodeapp being scaled also to 3 replicas.
Create 100 request from pythonapp
_podName=$(kubectl get po -ldapr.io/app-id=pythonapp -ojsonpath="{.items[0].metadata.name}")kubectl debug -it ${_podName} --image=nicolaka/netshoot -- sh -c 'for x in $(seq 100); do curl http://localhost:3500/v1.0/invoke/nodeapp/method/order/ ;done'Going one step further: Scale to Zero
One may have noticed that we used minReplicaCount: 1 in our ScaledObject so that there had to be always at least one replica of the nodeapp.
However, we can also use scale-to-zero feature KEDA provides with Dapr.
To achieve this, we have two options:
- Use another metric that is increased when
pythonappcan’t talk tonodeapp - Use another metric that is increased when
pythonappcan’t talk tonodeapptogether with Dapr’s resiliency mechanisms - Use http-scaler and also its interceptor for waking up the
nodeapp(transitively)
Approach 1:
cat <<VALUES | helm upgrade -i kedify-otel oci://ghcr.io/kedify/charts/otel-add-on --version=v0.0.4 -f -opentelemetry-collector: alternateConfig: processors: filter/ottl: error_mode: ignore metrics: metric: # drop all other metrics that are not whitelisted here - | name != "runtime/service_invocation/req_recv_total" and instrumentation_scope.attributes["app_id"] != "nodeapp" and instrumentation_scope.attributes["src_app_id"] != "pythonapp" and name != "http/server/response_count" and instrumentation_scope.attributes["app_id"] != "pythonapp" and instrumentation_scope.attributes["status"] != "500" service: pipelines: metrics: processors: [filter/ottl]VALUESAdd second trigger that uses the counter with errors as a mechanism for waking up the nodeapp service.
apiVersion: keda.sh/v1alpha1kind: ScaledObjectmetadata: name: dapr-nodeappspec: scaleTargetRef: name: nodeapp triggers: - type: kedify-otel metadata: scalerAddress: 'keda-otel-scaler.default.svc:4318' metricQuery: 'sum(runtime_service_invocation_req_recv_total{app_id="nodeapp",src_app_id="pythonapp"})' operationOverTime: 'rate' targetValue: '1' clampMax: '10' - type: kedify-otel metadata: scalerAddress: 'keda-otel-scaler.default.svc:4318' metricQuery: 'sum(http_server_response_count{app_id="pythonapp",method="POST",path="/neworder/",status="500"})' operationOverTime: 'rate' targetValue: '1' clampMax: '1'To apply this custom resource, run:
kubectl apply -f https://raw.githubusercontent.com/kedify/otel-add-on/74751f1f89/examples/dapr/nodeapp-so-v2.yamlDownside of this approach is the fact that first couple of requests are lost.
Approach 2 - Two OTEL scalers with resiliency enabled:
Dapr provides a way to re-try requests between the applications. We can leverage this feature and use metrics from this feature for
waking up the nodeapp service.
First, add the dapr_resiliency_activations_total metrics to otel collector configuration as allowed metric.
cat <<VALUES | helm upgrade -i kedify-otel oci://ghcr.io/kedify/charts/otel-add-on --version=v0.0.4 -f -opentelemetry-collector: alternateConfig: processors: filter/ottl: error_mode: ignore metrics: metric: # drop all other metrics that are not whitelisted here - | name != "runtime/service_invocation/req_recv_total" and instrumentation_scope.attributes["app_id"] != "nodeapp" and instrumentation_scope.attributes["src_app_id"] != "pythonapp" and name != "resiliency/activations_total" and instrumentation_scope.attributes["app_id"] != "pythonapp" and instrumentation_scope.attributes["target"] != "app_nodeapp" service: pipelines: metrics: processors: [filter/ottl]VALUESApply a CR from Dapr that’s responsible for enabling the resiliency features.
cat <<RES | kubectl apply -f -apiVersion: dapr.io/v1alpha1kind: Resiliencymetadata: name: nodeapp-service-resiliency namespace: defaultscopes: [pythonapp]spec: policies: timeouts: min: 1m retries: retryFast: policy: constant duration: 0.5s maxRetries: 120 targets: apps: nodeapp: retry: retryFast timeout: minRESFinally, apply the updated ScaledObject that has this new metric as a secondary trigger for scaling.
kubectl apply -f https://raw.githubusercontent.com/kedify/otel-add-on/c1010edb7a/examples/dapr/nodeapp-so-v2.5.yamlNow the nodeapp service can be scaled to zero replicas and we shouldn’t be losing any requests.
Approach 3 - Combination of two different ScaledObjects:
HTTP Scaler & otel-add-on. This approach assumes the Kedify HTTP Scaler and Kedify agent are already installed.
Internally it could have been using the service-autowiring feature
to switch
the traffic between the internal Kedify Proxy and original interceptor that can hold the http request until given service has an endpoint.
Unfortunatelly, we can’t use this approach for waking up the nodeapp service at the moment, because Dapr operator doesn’t allow changes to their Service that exposes the
dapr sidecar on the destination service. However, we can use this scaler for requests coming from the outside of the Kubernetes cluster. So this scaler can be used as an
entrypoint scaler for the very first service and for other internal microservice you can use the Approach 2.
Kedify Proxy based on Envoy is being used here as a more performant interceptor in terms of throughput and also more lightweight in terms of CPU and memory consumption. The original interceptor coming from HTTP add on is also being used, but only for its ability to wait for the very first pod to be ready and forward the first request successfully.
Conclusion
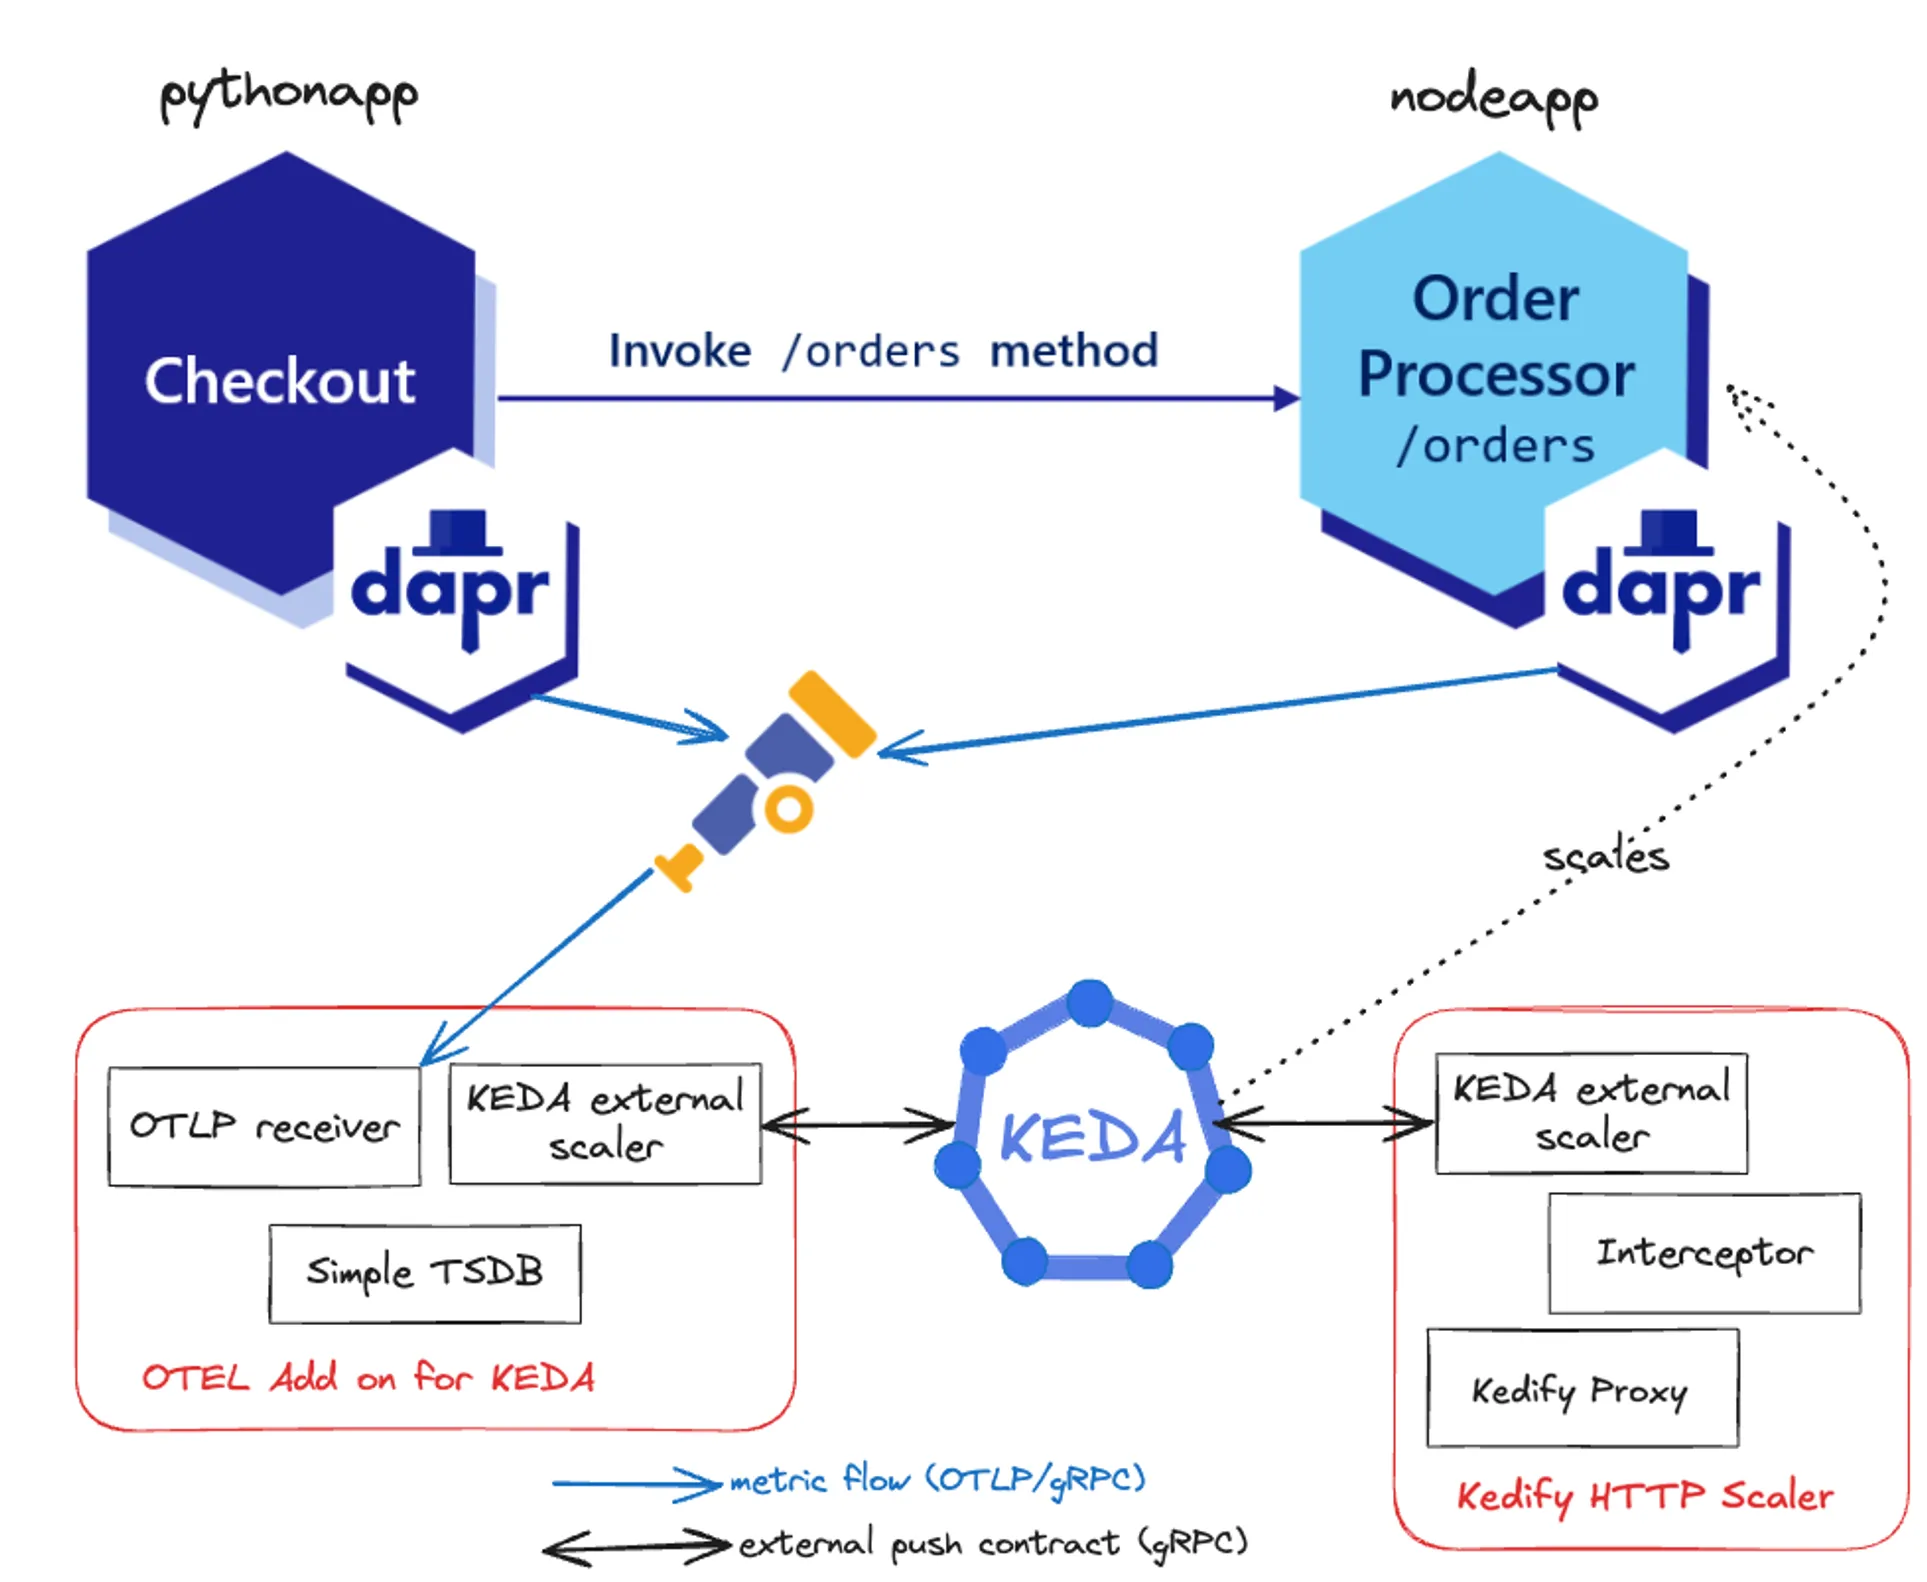
In the demo, we utilized metrics from two different microservices to scale them horizontally based on how rapidly the counters were increasing. Specifically, we used a counter metric from the Dapr ecosystem that tracks how many calls Service A made to Service B. Leveraging this metric allowed us to autoscale Service B efficiently.
By using metrics directly through OpenTelemetry, we gained several advantages, including improved speed, reduced latency, and enhanced stability. Most notably, we achieved the scale to zero scenario for Service B - a capability that wouldn’t have been possible with indirect metrics solutions like Prometheus or Datadog. By eliminating the need for an intermediate metrics store, we simplified the architecture and improved overall performance.
If you’re interested in more examples of this setup in action, feel free to explore: github.com/kedify/otel-add-on/tree/main/examples
Recording
Here you can watch a recording that demonstrates all the steps outlined in this blog post.
Further advanced ideas:
- we can control the “backpressure” in the other way around and let the consumers (/callers) to regulate the number of producers (/receivers)
- cascading - workload one -> workload two -> workload three
- apply the knowledge from the blog post on the Actor model implemented in Dapr and scale number of actors based on a well defined SLO
.
