Prometheus Autoscaling in Kubernetes: Why HPA Needs KEDA

November 20, 2023
Introduction
If you want to autoscale Kubernetes workloads from Prometheus metrics, the practical choice is usually KEDA, not wiring Prometheus into HPA directly. HPA can consume external metrics, but exposing Prometheus data through the Kubernetes metrics APIs requires extra adapters, more operational overhead, and still does not solve scale-to-zero behavior.
That matters because many real workloads are not driven by CPU or memory alone. Kafka backlog, HTTP request rate, queue depth, and user-facing latency all describe application pressure better than plain resource consumption.
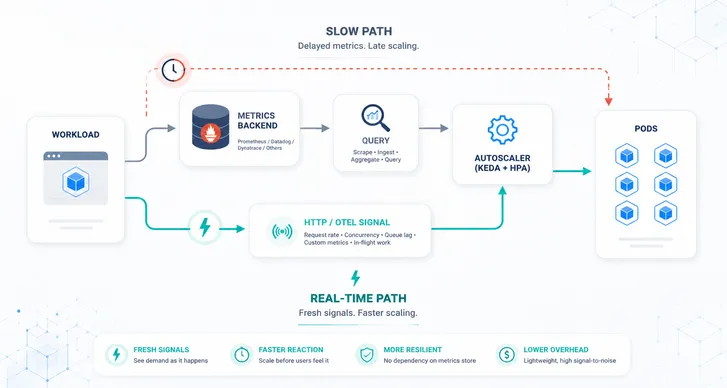
In this post, we explain why Prometheus Adapter often becomes the painful part of the stack, how KEDA simplifies Prometheus-based autoscaling, and when you should consider moving to faster push-based signals such as OpenTelemetry-driven autoscaling.
For example:
-
Event-Driven Applications: Consider a Kafka-driven setup. While CPU usage might remain stable, a surge in incoming Kafka events is the real metric that determines load. In such a case, autoscaling should ideally respond to the rate of incoming events or the message backlog.
-
E-Commerce Transactions: In an e-commerce framework, special sale events might see a spike in order checkouts. The CPU might be unperturbed, but the genuine load can be accumulating unprocessed orders in a database queue.
These metrics offer a more responsive approach to autoscaling compared to just CPU and RAM. In Kubernetes, these metrics are called custom metrics To scale based on custom metrics, you need to satisfy the below requirements:
-
Storage Engine: Custom metrics have to be stored in a time series database such as Prometheus, Graphite, Victoria Metrics, etc.
-
Metrics Adapter: An adapter translates the custom metrics gathered in the storage engine into a format that HPA can understand and use. While you can implement your own metrics adapter, it has challenges of its own that we highlighted our previous .
Addressing these needs, KEDA emerges as an effective solution. In this blog post, we will explore how easy it is to use Prometheus Metrics as a source for taking scaling decision with KEDA
Let’s start by understanding why Prometheus is an ideal choice for storing custom metrics.
Leveraging Prometheus Metrics for Autoscaling
Prometheus has established itself as the go-to standard for metric
storage. Modern applications are increasingly being configured to emit
telemetry in Prometheus format, complemented by the availability of exporters![]() for many popular systems. If your cluster already includes Prometheus, you have
a great source of Custom Metrics at your disposal.
for many popular systems. If your cluster already includes Prometheus, you have
a great source of Custom Metrics at your disposal.
Prometheus excels in collecting, storing, and querying time-series data,
making it an ideal choice for custom metrics. Moreover, It seamlessly
integrates with Kubernetes, either using kubernetes_sd_configs![]() or
or ![]() , offering a native experience for monitoring Kubernetes clusters and the
applications running on them.
, offering a native experience for monitoring Kubernetes clusters and the
applications running on them.
The benefits of using Prometheus for storing custom metrics is evident:
-
Prometheus instrumentation libraries are available for all major languages.
-
No need to write custom code for systems that do not support Prometheus format yet, there are exporters available for all major systems.
-
Its powerful querying language, PromQL, allows for fine-grained analysis and aggregation of data, enabling precise scaling decisions.
That being said, choosing the right adapter to interface with your storage engine is as crucial as to select the storage engine itself.
Prometheus Adapter: The Old Timer
As noted, we require an adapter for utilizing custom metrics. Owing to
the challenges of writing custom adapters, the Kubernetes SIG community
has developed the Prometheus ![]() .
.
Prometheus Adapter is a Kubernetes Custom Metrics API implementation which exposes selected Prometheus metrics through the Kubernetes API for the HPA to scale on. This can be an HTTP request rate, or a RabbitMQ queue length or any metric from Prometheus.
Prometheus Adapter does the job, but many teams found its configuration cryptic and complicated. Here is an example;
rules: - seriesQuery: '{__name__=~"^container_.*",container!="POD",namespace!="",pod!=""}' resources: overrides: namespace: { resource: 'namespace' } pod: { resource: 'pod' } name: matches: '^container_(.*)_seconds_total$' metricsQuery: 'sum(rate(<<.Series>>{<<.LabelMatchers>>,container!="POD"}[2m])) by (<<.GroupBy>>)'In the Prometheus adapter, custom metrics are exposed by writing rules, where each rule consists of four parts:
-
Discovery, which specifies how the adapter should find all Prometheus metrics for this rule.
-
Association, which specifies how the adapter should determine which Kubernetes resources a particular metric is associated with.
-
Naming, which specifies how the adapter should expose the metric in the custom metrics API.
-
Querying, which specifies how a request for a particular metric on one or more Kubernetes objects should be turned into a query to Prometheus.
While there are several blog posts and documentation out there explaining its configuration syntax, many teams could not make it work reliably with their custom metric scaling needs.
Furthermore, considering the future aspects:
-
The Prometheus Adapter relies on a single ConfigMap for its configuration, which can encounter the 1MB size limit imposed by ETCD.
-
Maintenance of the single configuration file can be cumbersome, it’s hard to isolate individual teams. Any mistake in a configuration of a single workload can break functionality of the whole adapter.
-
The adapter can connect only to a single instance at any time. If your metrics are spread over multiple Prometheus instances. This is not the right fit
-
Additional configuration and tools are required to support modern workflows such as securely providing authentication credentials of Prometheus.
-
Scaling to zero is not achievable.
In the next section, we will see how KEDA doesn’t stop at just overcoming the limitations of Prometheus Adapter; it goes above and beyond, offering functionalities that redefine autoscaling.
Simplifying Autoscaling with KEDA and Prometheus
KEDA, which stands for Kubernetes Event-Driven Autoscaler, enables the
scaling of pods based on external event sources. KEDA supports more than 60+ predefined event sources (scalers)![]() including the Prometheus Scaler
including the Prometheus Scaler![]() . To consume these event
sources, KEDA simplifies the process by providing a clean, user-friendly
interface through Kubernetes Custom Resource Definitions (CRDs).
. To consume these event
sources, KEDA simplifies the process by providing a clean, user-friendly
interface through Kubernetes Custom Resource Definitions (CRDs).
Here’s an example of configuring KEDA with Prometheus scaler:
apiVersion: keda.sh/v1alpha1kind: ScaledObjectmetadata: name: prometheus-scaledobjectspec: scaleTargetRef: name: my-deployment triggers: - type: prometheus metadata: serverAddress: http://<prometheus-host>:9090 query: sum(rate(http_requests_total{deployment="my-deployment"}[1m])) threshold: '100.50' activationThreshold: '5.5' authenticationRef: name: keda-prom-credsAdvantages of KEDA Over Prometheus Adapter
-
Ease of Use: KEDA’s integration with Kubernetes through CRDs (ScaledObject and ScaledJob) makes it incredibly straightforward to set up and manage. The YAML definitions are intuitive and easy to configure, even for complex scaling requirements.
-
Flexibility and Versatility: KEDA supports a wide array of scalers, including Prometheus. This versatility allows it to cater to various application needs and scaling scenarios, unlike the more limited scope of Prometheus Adapter.
-
Scale Down to Zero: When there are no pending events or metrics triggering the workload, KEDA can automatically scale down the application to zero, reducing resource consumption to a minimum.This feature is useful for optimizing costs in cloud environments where resources are allocated on-demand.
Utilizing the Prometheus scaler with KEDA allows for safe scaling down of applications to zero. This is because metrics are sourced indirectly from Prometheus, rather than directly from the application itself, ensuring metric continuity even when the application is scaled down. -
Authentication Providers: KEDA connects with various external entities to fetch metrics**,** ensuring secure connections with external entities is paramount. KEDA addresses this concern through Authentication Providers
 , which offer a mechanism for secure authentication.This approach relies on
established best practices concerning secret management, such as IRSA,
Hashicorp Vault, and Azure Pod Identity, guaranteeing the confidentiality and
integrity of sensitive data.\ This method provides an easy way to manage the
credentials required for connecting with the external resource. In the above
ScaledObject definition, the below configuration references a TriggerAuthentication
Object that holds authentication credentials of the Prometheus server, which
is utilized by KEDA to connect securely.
, which offer a mechanism for secure authentication.This approach relies on
established best practices concerning secret management, such as IRSA,
Hashicorp Vault, and Azure Pod Identity, guaranteeing the confidentiality and
integrity of sensitive data.\ This method provides an easy way to manage the
credentials required for connecting with the external resource. In the above
ScaledObject definition, the below configuration references a TriggerAuthentication
Object that holds authentication credentials of the Prometheus server, which
is utilized by KEDA to connect securely.
authenticationRef:name: keda-prom-credsNote: A TriggerAuthentication object can be referenced by multiple
ScaledObject. For a detailed example, refer to this documentation![]() .
.
- Advanced Scaling Features: KEDA provides advanced features such as
For an in-depth explanation, check out this blog post. With the basics of KEDA elucidated, let’s see an example of using Prometheus Scaler with KEDA.
Setting up KEDA with Prometheus Scaler
In the following setup, we assume that you have Prometheus installed in
your cluster and that it is configured to scrape metrics from a
deployment. Refer to this documentation![]() to install Prometheus if it is not already installed.
to install Prometheus if it is not already installed.
Instructions
- Install KEDA:
Use Helm to install KEDA into your Kubernetes cluster.
helm repo add kedacore https://kedacore.github.io/chartshelm repo updatehelm install keda kedacore/keda --namespace keda --create-namespace- Configure Authentication Credentials:
When you configure KEDA to connect with different applications (such as Prometheus), it is crucial to provide the authentication credentials in a secure manner. As discussed above, KEDA provides Trigger Authentication CRD for configuring authentication with external applications.
In our case the prometheus instance uses bearer token based authentication. Here is an example configuring the same.
apiVersion: v1kind: Secretmetadata:  name: keda-prom-secret  namespace: defaultdata:  bearerToken: 'BEARER_TOKEN'
---apiVersion: keda.sh/v1alpha1kind: TriggerAuthenticationmetadata:  name: keda-prom-creds  namespace: defaultspec:  secretTargetRef:    - parameter: bearerToken      name: keda-prom-secret      key: bearerToken
Note: The above example uses Kubernetes Secret for demonstration
purposes only. Please refer to this documentation![]() to know about how to use cloud-native secret management solutions.
to know about how to use cloud-native secret management solutions.
- Configure Prometheus Scaler:
Set up a ScaledObject in YAML file that references your Prometheus server and specifies the metric query. Here’s an example configuration:
apiVersion: keda.sh/v1alpha1kind: ScaledObjectmetadata: name: prometheus-scaledobject namespace: kedaspec: fallback: failureThreshold: 3 replicas: 6 maxReplicaCount: 12 scaleTargetRef: name: dummy triggers: - type: prometheus metadata: serverAddress: http://<prometheus-host>:9090 threshold: '100' activationThreshold: '5.5' query: sum(rate(http_requests_total{deployment="my-deployment"}[2m])) authModes: 'bearer' authenticationRef: name: keda-prom-credsEssential Settings and Parameters in the YAML
-
scaleTargetRef: Refers to the deployment you want to scale.
-
type: Set to prometheus to indicate the Prometheus scaler.
-
serverAddress: URL of your Prometheus server.
-
query: Prometheus query to fetch the metric value.
-
activationThreshold: The threshold on which KEDA decides if the workload should be scaled from/to zero.
-
threshold: Once KEDA has decided to scale out to 1 replica, this threshold decides to scale from 1 to N.
-
authenticationRef: Is the reference to the Trigger Authentication CRD that we configured in the previous step, providing authentication details to connect with Prometheus.
-
fallback: Incorporating a fallback mechanism into your scaled objects is a recommended best practice. This feature allows KEDA to adjust the application to a predefined number of replicas, as specified by the replicas field, in situations where it encounters difficulties in retrieving metrics from the designated source. The failureThreshold field is utilized to set the threshold at which the scaling should occur.
- Apply the Configuration: Apply this configuration to your Kubernetes cluster:
kubectl apply -f prometheus_scaledobject.yamlAfter configuring the scaler, you can test out the scaling behavior of the application by generating load on the application.
Conclusion
KEDA, in tandem with Prometheus metrics, presents a powerful solution for autoscaling in Kubernetes. Its ability to seamlessly integrate with Prometheus provides a straightforward approach to leverage custom metrics for dynamic scaling decisions. The simplicity and user-friendliness of KEDA stand in stark contrast to the complexities associated with the Prometheus Adapter.
KEDA’s extensive range of features, including scaling based on multiple metrics, complex scaling conditions, and the ability to scale down to zero, offers a level of flexibility that is not easily matched. Its compatibility with over 60 predefined event sources, including Prometheus, allows for a wide array of use cases, catering to the diverse needs of modern cloud-native applications.
For those who have already embraced Prometheus in their Kubernetes environment, KEDA emerges as the preferred choice. The combination of KEDA and Prometheus represents a significant step forward in simplifying and optimizing autoscaling in Kubernetes.