Stop Autoscaling on Yesterday's Metrics
July 01, 2026
Stop Autoscaling on Yesterday’s Metrics
Autoscaling failures often look like infrastructure failures. Pods were too slow. Nodes arrived too late. HPA did not add replicas. KEDA did not activate in time. The database got hammered. Those things may all be true, but they are usually downstream symptoms.
The real problem often starts earlier in the loop: the autoscaler learned about demand too late.
That is the uncomfortable part. Your dashboards can be green and your autoscaling can still be wrong. Observability systems explain what happened. Autoscaling systems decide what happens next. These are related jobs, but they are not the same job.
Autoscaling Is a Control Loop, Not a Dashboard
A dashboard is allowed to be late. A scaling decision is not.
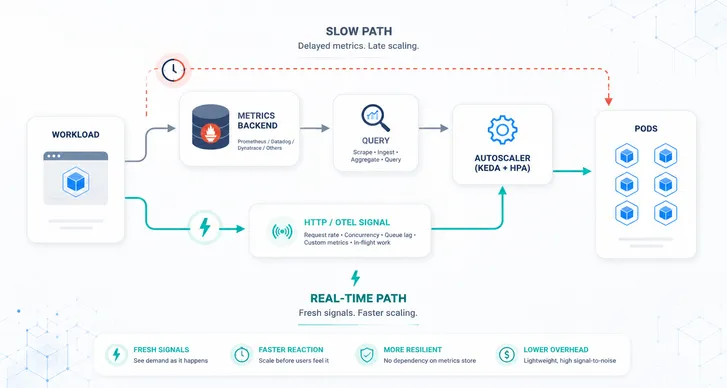
A typical metrics-based scaling path has several hops. The workload emits metrics. Prometheus scrapes them, or a hosted metrics API ingests and aggregates them. KEDA checks trigger sources for activation. HPA reads external metrics on its own sync interval. Kubernetes schedules new pods, and those pods still need to become ready.
Every component in that chain may be healthy. The combined loop can still be late.
If Prometheus scrapes every 30 or 60 seconds, or if a hosted metrics backend adds ingestion delay, query latency, rate limits, or cross-cluster round trips, the autoscaler is no longer reacting to demand as it happens. It is reacting to a delayed summary of demand.
That can be fine for slow workloads. It is not fine for short traffic spikes, latency-sensitive APIs, real-time HTTP scaling, queue workers with fast-growing backlog, or AI inference endpoints where waiting requests can become expensive in seconds.
The operational version is simple:
If your autoscaler depends on a remote metrics query during a spike, your metrics backend is now part of your production capacity path.
That does not mean Prometheus is bad. It also does not mean Datadog, Dynatrace, or any other observability platform is bad. It means they are often being asked to do a job they were not designed to own. They are very good at collecting, storing, querying, and explaining telemetry. They are not automatically good real-time control planes.
Observability Metrics Are Not Scaling Metrics
For observability, delay is acceptable. You want durable storage, flexible queries, historical context, dashboards, alerts, and correlation. A few seconds or even a minute of delay may be perfectly fine if the goal is to understand behavior, debug incidents, or prove what happened later.
Autoscaling has a different contract. The signal should arrive quickly, be cheap to evaluate, have stable cardinality, and relate directly to capacity. It should keep working during the burst, not become another bottleneck inside it.
That is why “what is my CPU right now?” is usually the wrong first question. A better question is “how much work is arriving or waiting?” CPU and memory still matter, especially for right-sizing, health, and CPU-bound workloads. But for bursty APIs, queue workers, and inference services, they are often late horizontal scaling signals.
| Workload | Better first scaling signal | Why it works |
|---|---|---|
| HTTP API | Request rate, concurrency, in-flight requests | It tracks demand before CPU saturation |
| Queue worker | Queue length, backlog age, consumer lag | It tracks waiting work |
| AI inference | Waiting requests, active requests, first-token latency, KV cache pressure, GPU capacity | It tracks user-visible pressure and serving limits |
| Recurring spike | Live demand signal plus short-horizon forecast | It adds capacity before the pattern repeats |
This distinction sounds academic until you watch a short spike move through production. The dashboard eventually shows the spike. The autoscaler needed to know about it before users felt it.
Pick the Signal That Matches the Workload
Do not push every metric into the autoscaler.
Scaling metrics should be boring and intentional. One or two signals per workload are usually enough. If a service needs five metrics, it probably needs a clearer operating model, not a smarter formula.
For HTTP services, start with request rate or concurrency from the Kedify HTTP Scaler. That gives request-driven workloads a real-time path from incoming traffic to scaling decisions without building a separate Prometheus-based HTTP autoscaling pipeline.
For application-specific pressure, use OTel-based custom metrics![]() . The Kedify OpenTelemetry Scaler keeps selected scaling signals close to the workload and out of the long-term metrics store.
. The Kedify OpenTelemetry Scaler keeps selected scaling signals close to the workload and out of the long-term metrics store.
For queues, scale on backlog age, queue length, or consumer lag. For inference, start with waiting requests, active requests, latency, KV cache pressure, and GPU capacity signals. For recurring spikes, blend the live signal with a short-horizon forecast from predictive autoscaling.
Use CPU and memory for what they are good at: health, resource pressure, vertical sizing, and workloads where resource usage really does track demand.
Keep the Metrics Backend, Shorten the Scaling Path
Many teams start with Prometheus because it is already there. Others start with Datadog or Dynatrace because that is where the platform team already sends production telemetry. That is reasonable, and it may work for a long time.
Then the platform grows: more namespaces, more ScaledObjects, tighter polling, more teams, more dashboard queries, more SaaS metric calls, more cross-region traffic. Eventually the scaling system starts creating pressure on the observability system. Queries get slower. Rate limits appear. Metric values are stale. KEDA behaves correctly, but the input is already old.
This is where teams usually try to tune harder. They scrape more often, poll more often, reduce cooldowns, add Prometheus capacity, raise vendor limits, or move queries closer to the cluster. Some of that helps. None of it changes the basic shape of the loop.
The better pattern is to keep your metrics backend for what it is great at and move scaling decisions to a shorter path. The HTTP Scaler![]() uses actual HTTP traffic as the scaling signal. The Kedify OpenTelemetry Scaler uses selected OpenTelemetry metrics for real-time application pressure. Prometheus, Datadog, Dynatrace, or another backend still stores history, powers dashboards, and supports alerting.
uses actual HTTP traffic as the scaling signal. The Kedify OpenTelemetry Scaler uses selected OpenTelemetry metrics for real-time application pressure. Prometheus, Datadog, Dynatrace, or another backend still stores history, powers dashboards, and supports alerting.
The Operating Checklist
Start with the path, not the tool. For every autoscaled workload, ask:
- What demand should add capacity?
- How quickly does that capacity need to appear?
- How old can the metric be before the decision is wrong?
- Which metric has stable cardinality and cheap evaluation?
- What downstream system fails first if the workload scales too far?
- What should happen when the metric is missing or stale?
The answers should determine the scaler and the guardrails. HTTP services should usually scale on request rate or concurrency. Workers should scale on backlog, lag, or oldest-message age. Custom application pressure should travel through OpenTelemetry when it needs a real-time scaling path. Metric failures should have fallback behavior. Shared databases, brokers, and APIs should be protected with realistic maxReplicaCount values and group-level caps. The full loop should be tested with autoscaling checks, not assumed from a metric dashboard.
The Practical Architecture
The architecture that survives scale is not complicated:
- Observability backend for history, dashboards, alerts, and incident analysis
- HTTP Scaler for real-time request traffic
- OpenTelemetry Scaler for real-time application-specific pressure
- KEDA and HPA for Kubernetes-native scaling decisions
- Kedify features for HTTP scaling, OTel scaling, predictive scaling, ScalingGroups, vertical scaling, and operational visibility
This is not about replacing observability. It is about removing observability storage from the critical path where it does not belong.
Conclusion
Autoscaling is only as good as the signal it receives.
If the signal is late, averaged, rate-limited, or routed through a system optimized for historical analysis, the autoscaler will make late decisions. It may do everything correctly and still fail your users.
Use observability systems to understand what happened. Use real-time workload signals to decide what should happen next. That separation fixes more autoscaling problems than most tuning sessions.