One Does Not Simply Use Prometheus Metrics for Autoscaling
December 15, 2025
Introduction
Prometheus is everywhere. Teams already depend on it for dashboards, alerts, SLOs, and cost reviews. So when they reach for KEDA to autoscale their applications, the temptation is obvious:
“We already have metrics in Prometheus, let’s just use those.”
It works on small clusters. It works for workloads that scale slowly. And then it doesn’t.
Past a certain point, Prometheus-based autoscaling introduces systemic lag, control-plane pressure, and network load that directly contradict the goals of real-time scaling. As traffic patterns become bursty and services become more latency-sensitive, the cracks show quickly.
This post explains why Prometheus, Datadog, Dynatrace, and other pull-based metric stores become unreliable for time-critical autoscaling decisions and why real-time push-based OpenTelemetry signals fundamentally fix the control loop.
If you rely on KEDA today, or if you’ve hit scaling delays you can’t quite explain, read on.
Fix Prometheus-based autoscaling bottlenecks
See how Kedify’s OTel scaler cuts latency from your control loops.
Get StartedThe assumptions that break at scale
Prometheus was designed for observability, not real-time control. That distinction becomes painful once you use it to drive autoscaling.
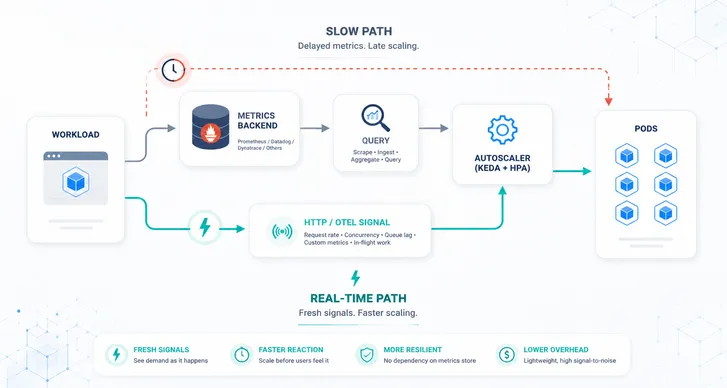
Scrape → store → query → scale
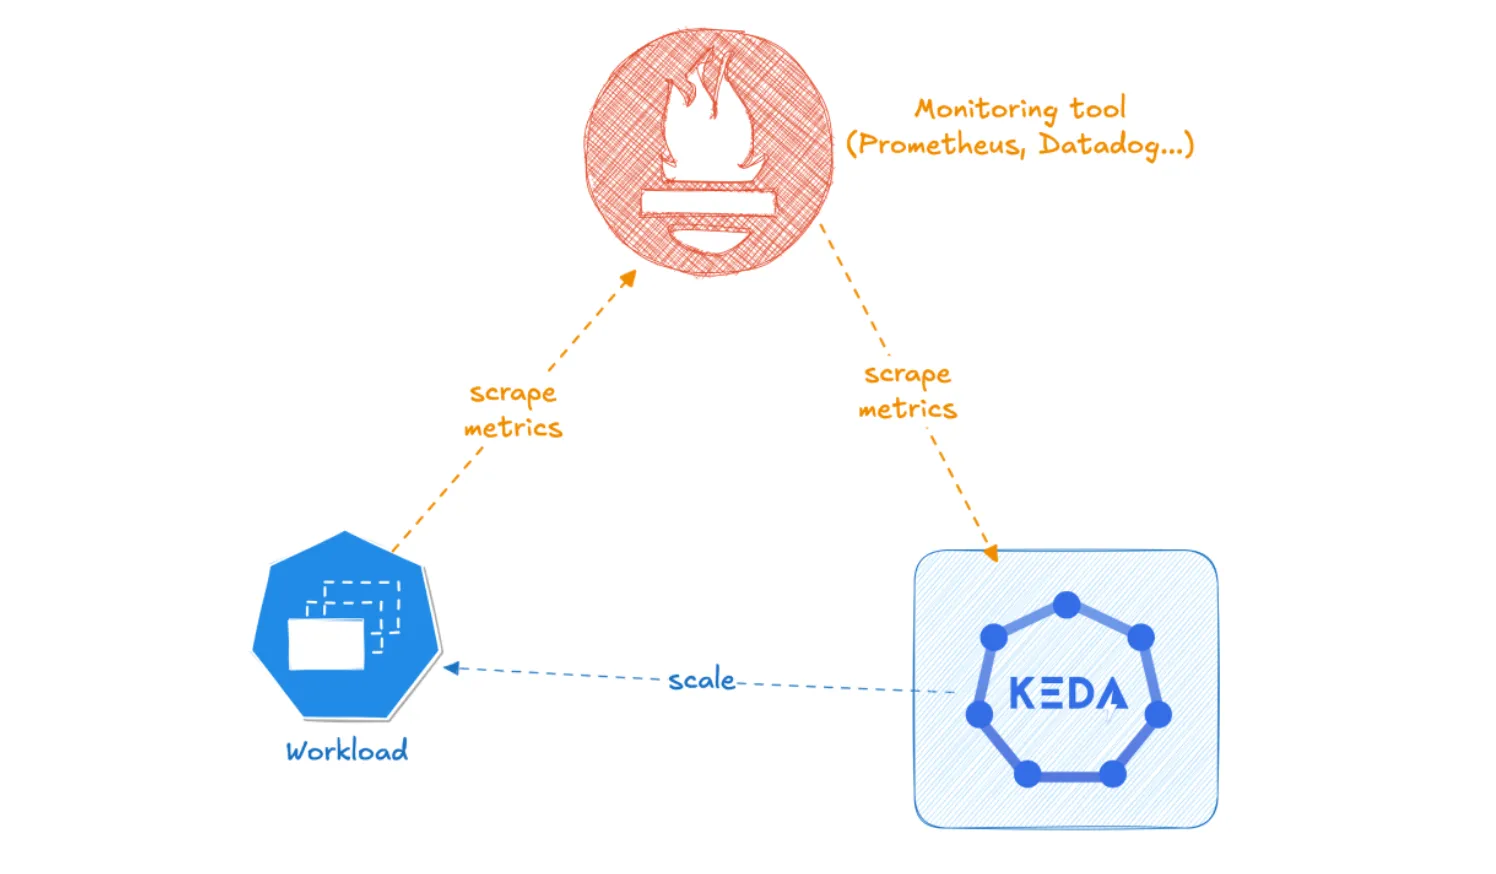
This loop sounds reasonable, but each step inserts latency:
- The workload emits metrics.
- Prometheus scrapes them on a 30–60s interval.
- KEDA polls Prometheus on its own interval (often also ~30s).
- HPA performs its sync (~15s).
- Only then do replicas start moving.
In even the best configuration, autoscaling decisions often operate on 30–90 seconds-old data. For a 15–30 second traffic spike, this means scaling after the spike has already ended. SLOs slip, p95 rises, dashboards look misleading, and the autoscaler appears “slow” despite behaving as designed.
Teams try to fix this by tightening Prometheus scrape intervals or KEDA polling intervals. That is when the second set of problems emerges.
The load chain and why Prometheus becomes a bottleneck
Each KEDA ScaledObject performs its own metric queries. With dozens of scaled workloads, these queries stack quickly. Add HPA polling every 15 seconds and you create persistent load on:
- the Prometheus server (CPU, storage I/O, query engine)
- the Kubernetes API server (HPA syncs)
- the network path between cluster and your metrics backend
If Prometheus is hosted in a different cluster or in a vendor SaaS (Datadog, Dynatrace), these calls become cross-zone or cross-region traffic. That introduces latency and directly increases costs. Datadog and Dynatrace have rate limits that many teams unknowingly hit the moment they shrink KEDA polling intervals.
The outcome is counterintuitive:
The autoscaler starts failing because the observability system can’t keep up.
Queries time out. KEDA receives stale values. HPA delays. The control plane becomes noisy. And scaling decisions become both slower and less predictable.
Why pull-based metrics fundamentally introduce lag
Autoscaling loops work best when the signal path is short:
workload → scaler → decision → replicas
Prometheus adds two intermediaries: a scraper and a query engine. Both add latency, retries, and rate-limit behavior. When teams try to reduce this lag, they overload the metric store.
Autoscaling on stale data is not just inconvenient. It directly harms:
- p95/p99 latency during short bursts
- ability to scale from zero reliably
- downstream systems that receive unbounded load while autoscaling lags
- cost efficiency, since scaling in is also delayed
- user-facing reliability (dropped requests before a scale-up)
The fix is not to tune Prometheus harder. The fix is to remove it from the critical path.
A push-based alternative: OpenTelemetry as the autoscaling signal
OpenTelemetry is already the emerging standard for distributed telemetry. What it provides for autoscaling is simple but transformative: push-based signals with no scrape delay.
The Kedify OpenTelemetry Scaler![]() takes advantage of this model:
takes advantage of this model:
- Workloads are scraped or push the metrics they care about directly into an OTel Collector.
- The Collector forwards only relevant autoscaling metrics to the scaler.
- The scaler pushes decisions to KEDA with no polling and near-real-time latency.
- Prometheus remains free to do what it’s good at: long-term storage and dashboards.
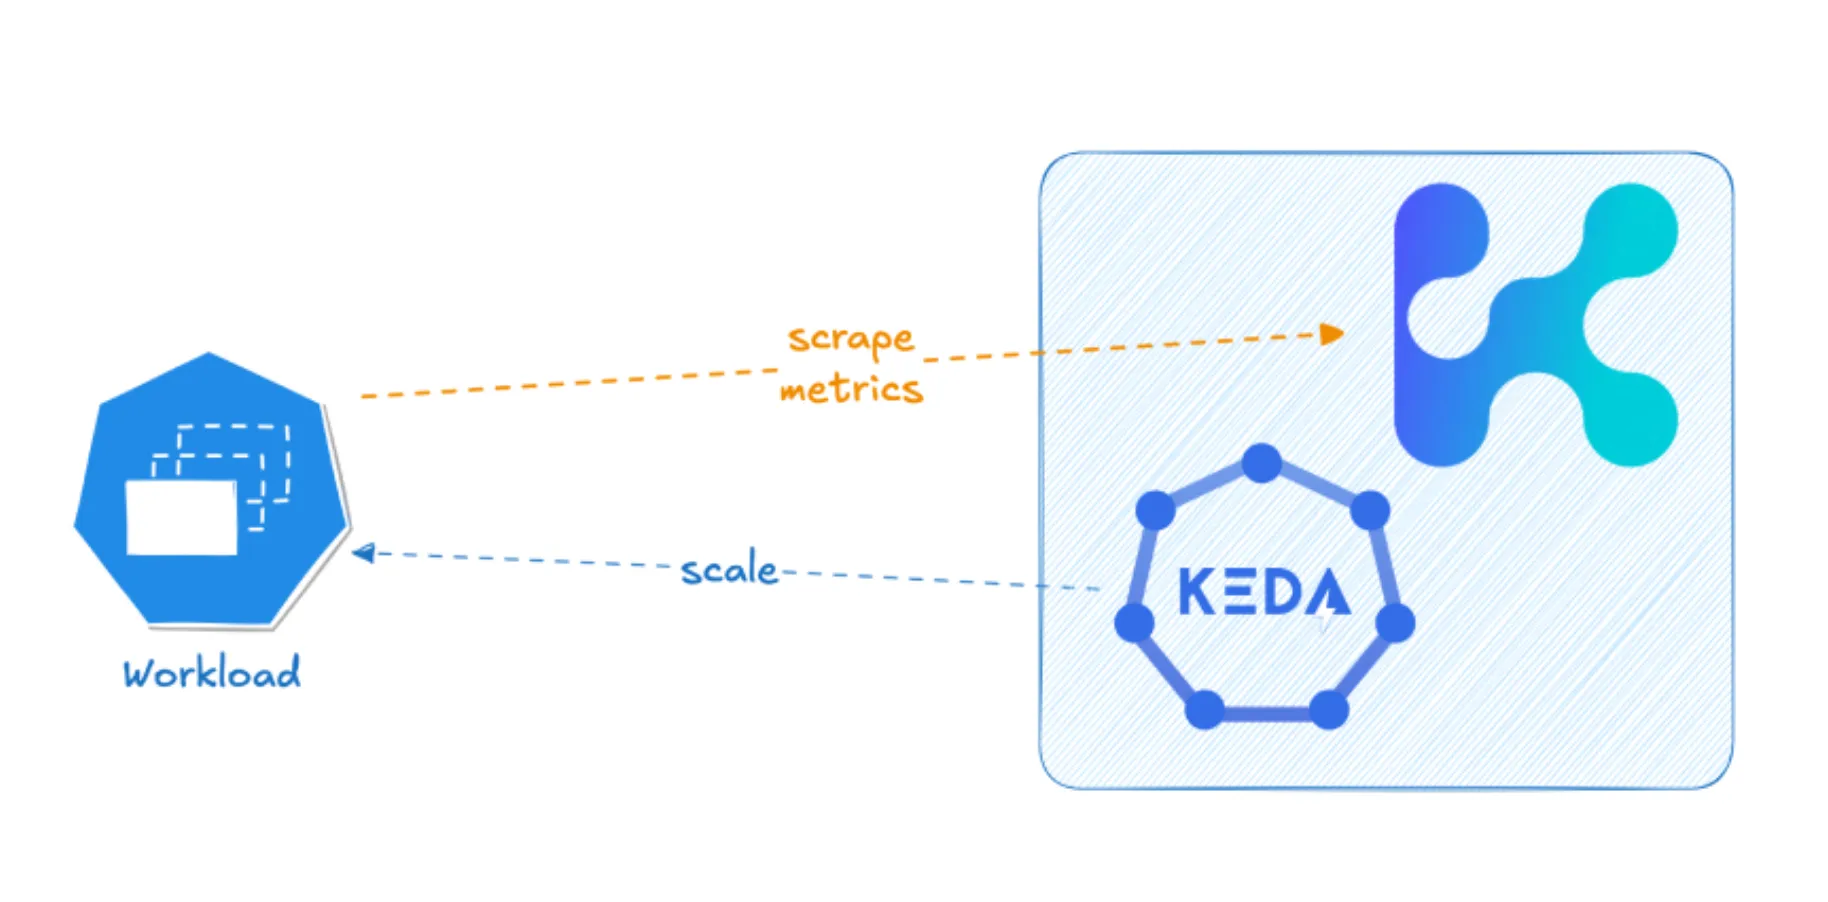
Because metrics flow only inside the cluster (unless you choose to ship OTel data externally), you eliminate the cross-zone cost and rate-limit issues that plague Prometheus-based autoscaling.
Hands-on: replace Prometheus scaling with OTel push
A typical ScaledObject using the Kedify OTel Scaler looks like this:
apiVersion: keda.sh/v1alpha1kind: ScaledObjectmetadata: name: paymentsspec: scaleTargetRef: name: api minReplicaCount: 1 maxReplicaCount: 60 triggers: - type: kedify-otel metadata: metricQuery: 'sum(inprogress_tasks{job="app"})' targetValue: '40'Your service emits inflight request count via OTel, the Collector forwards it, and the scaler acts immediately. Prometheus remains optional for visualization, not mandatory for control.
What you see in practice
Teams that switch from Prometheus to push-based autoscaling report consistent patterns:
- p95 no longer spikes during 15–30s bursts
- replica counts mirror request curves instead of trailing them
- HPA sync behavior becomes predictable
- Prometheus load drops dramatically
- Datadog/Dynatrace metric costs fall due to fewer queries
- scale-in becomes smoother because data freshness is guaranteed
Latency becomes a function of workload behavior, not a function of scrape schedules.
Conclusion
Prometheus, Datadog, Dynatrace, and similar pull-based metric stores were not designed for real-time control loops. As workloads scale and traffic patterns become bursty, the limitations of scrape intervals, query load, and network costs become apparent.
Switching to push-based OpenTelemetry signals for autoscaling eliminates these bottlenecks. By shortening the signal path and reducing load on the metrics backend, teams achieve more reliable, responsive, and cost-effective autoscaling with Kedify.
Resources
- Kedify OpenTelemetry Scaler Overview

- Kedify OpenTelemetry Scaler Documentation
- Prometheus to OpenTelemetry Scaler Migration Guide
⸻
Want to see Kedify in action?
Book a call with our team. We’ll show you how Kedify can fix your autoscaling bottlenecks and help you get more from your Kubernetes workloads.