The Evolution of Kubernetes Autoscaling: From HPA to Real-Time, Event-Driven Control
October 02, 2025
Introduction
Autoscaling in Kubernetes has come a long way, but for many teams, it still feels too slow, too coarse, or too unpredictable. Why does latency spike during short traffic bursts? Why does “scale to zero” work fine in dev but miss the mark in production?
The root issue is lag: between when demand changes and when your platform reacts. This post walks through the key eras of Kubernetes autoscaling: from cron-based capacity to real-time, event-driven loops and shows how 2025’s tooling finally lets us close that gap.
If you’re building latency-sensitive, cost-aware systems at scale, here’s what’s changed, what to adopt, and how to fix the broken control loops holding your SLOs hostage.
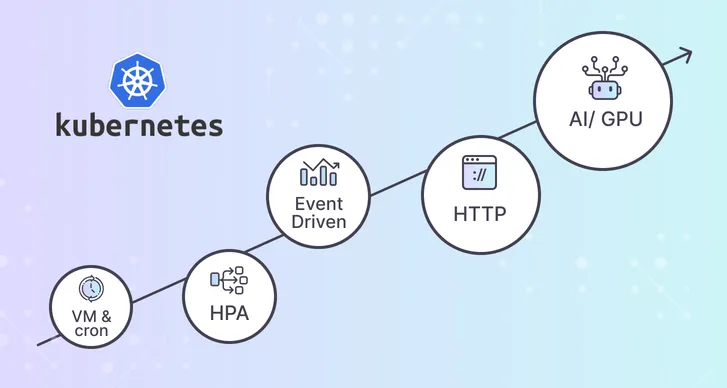
A short history and what each era taught us
VM and cron
Capacity increased on a schedule and we paid for headroom. It worked until traffic became spiky and global.
HPA era
Kubernetes gained a native control loop, usually driven by CPU and memory averages. That is fine for steady workloads, but when bursts last 10–30 seconds a polling loop plus scrape delays often reacts after the spike.
Event driven with KEDA
Scaling shifted to events like queue lag, backlog depth, and HTTP concurrency, while HPA still applied the replica math. Scale to zero became practical for the first time.
Real time and device aware, today
In-place Pod resize removes restart penalties so you can right-size without churn. DRA makes GPUs and accelerators first class in scheduling. Paired with HTTP and OTel push signals, autoscaling decisions track what users are doing in real time.
The lag chain and why it hurts SLOs
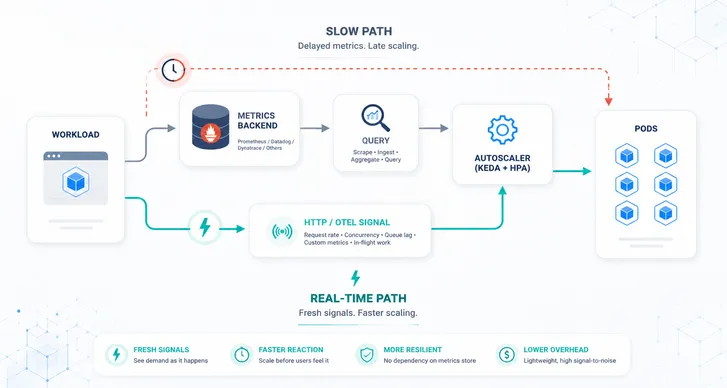
A burst occurs and the path to a decision is long. The app emits metrics. Something scrapes them. HPA syncs. The scheduler places pods. Images warm up. Endpoints finally turn ready.
With Prometheus scraping once per minute and HPA syncing about every 15 seconds, you can be 30–90 seconds late to a 20-second spike. That is how p95 slips while CPU looks normal.
Fix the loop.
Shorten the path and switch to push. Scale on live HTTP request rate or concurrency at the edge, and push application intent such as inflight, backlog age, or p95 through OpenTelemetry directly to the autoscaler. Keep pull scrapes for dashboards, not for time-critical decisions.
Why 2025 is different and what to do
- In place vertical scaling. Adjust resources on running Pods. Keep a small warm instance and bulk it up under load without a restart.
- DRA for devices. Express and allocate GPU claims natively so your control loop respects VRAM headroom and utilization, not just Pod counts.
- Gateway API maturity. It is easier to capture HTTP signals at the edge for sub-second scaling. Ingress remains GA and supported. Gateway is the successor pattern many teams adopt for new work.
- Nodes that keep up. With Karpenter version 1 and later, node provisioning and consolidation match the pace of pod-level decisions.
- FinOps urgency. Workload optimization and waste reduction are board priorities. Cost should become a control input in the scaling loop, not a downstream report.
The modern autoscaling playbook
-
Scale on intent with HTTP and OTel.
Use live request rate or concurrency for north–south traffic. Push inflight, backlog, or p95 via OTel for internal or async work. This removes scrape lag and reacts in sub-second time. -
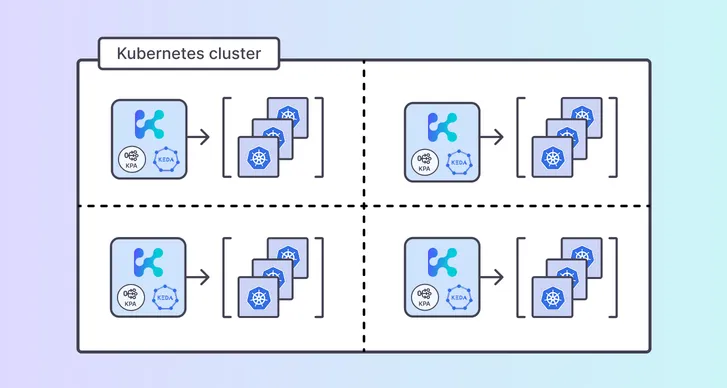
Separate pods from nodes.
Use an event-driven scaler to decide how many replicas you need. Let a modern provisioner such as Karpenter decide which nodes to run them on. Each loop stays fast and focused. -
Protect shared systems.
Add group-level caps so a burst on one service does not drown a shared database, cache, or feature store. Kedify ScalingGroups enforce a shared maximum across multiple ScaledObjects and allocate replicas fairly within that cap. -
Design wake-up UX, not timeouts.
If you scale to or near zero, hold the first request and serve a short waiting page while Pods warm up. Forward traffic once readiness passes. This protects both users and health checks.
Hands on: two copy-ready patterns
A) Real time HTTP and gRPC scaling with scale to zero
apiVersion: keda.sh/v1alpha1kind: ScaledObjectmetadata: name: storefrontspec: scaleTargetRef: name: web minReplicaCount: 0 maxReplicaCount: 80 triggers: - type: kedify-http metadata: hosts: www.example.com service: web-svc port: '8080' scalingMetric: requestRate targetValue: '120'This pattern reads live request signals at the proxy. If you are at zero, it queues the first hit and optionally could serve a simple waiting page until the app is ready. That keeps SLOs intact during short spikes.
B) SLO aware scaling with OTel push, no Prometheus in the loop
apiVersion: keda.sh/v1alpha1kind: ScaledObjectmetadata: name: checkoutspec: scaleTargetRef: name: api minReplicaCount: 1 maxReplicaCount: 50 triggers: - type: kedify-otel metadata: metricQuery: 'sum(rate(api_inflight_requests[30s]))' targetValue: '50'Your services push the signals you care about into the OTel Collector and the scaler reacts immediately. Prometheus remains for analysis, alerts, and capacity reviews.
What happens in practice
| Phase | Traffic pattern | Replicas | Latency outcome |
|---|---|---|---|
| Quiet hours | short bursts, long idle | 0–1 | First hit is queued, no 5xx, p95 stays flat |
| Spike 10–30s | sharp RPS jump | grows | Pod curve tracks the request curve in real time |
| Cool down | RPS drops quickly | stabilizes then scales in | No flapping, downstream systems stay healthy |
Teams typically see p95 stay smooth during spikes and a reduction in replica hours and GPU minutes once the scaling path uses push signals with guardrails.
Gotchas and quick fixes
-
Scaling too late: If you rely on minute-level scrapes and a polling HPA loop, you will scale after the spike. Put HTTP and OTel in the decision path.
-
First hit errors at scale from zero: Intercept and queue the first request and serve a waiting page until readiness passes.
-
Noisy neighbors: Use ScalingGroups to enforce shared caps around databases and rate-limited third-party APIs.
-
Edge confusion: Gateway API is the successor pattern, but Ingress remains GA. Migrate when it improves capability and signal quality, not because you have to.
Related reading
- Shrink Pods When Traffic Sleeps
- Handling Cold Starts Gracefully: Waiting and Maintenance Pages in HTTP Scaler
Call to action
Enable HTTP autoscaling on one latency-sensitive service in staging and watch the pod curve match the request curve in real time.
Docs: HTTP Scaler![]() | OTel Scaler
| OTel Scaler![]() | ScalingGroups
| ScalingGroups![]()
Quantify the business case with the ROI Calculator![]() and run a 30–45 day POC.
and run a 30–45 day POC.
Built by the core maintainers of KEDA. Battle-tested with real workloads.